
As a project manager and team leader, you want to be able to track the progress of your team. As well as have a detailed view of the task list to better coordinate work.
Since teams in many companies vary in size and are spread across multiple locations, the use of dashboards makes the most sense. With the help of a dashboard, which serves as a central information page, you can get a quick overview of your team’s tasks, as well as the metrics that are relevant to you.
Today we present you a use case how to build such a solution in your Redmine with the help of the Reporting Plugin.
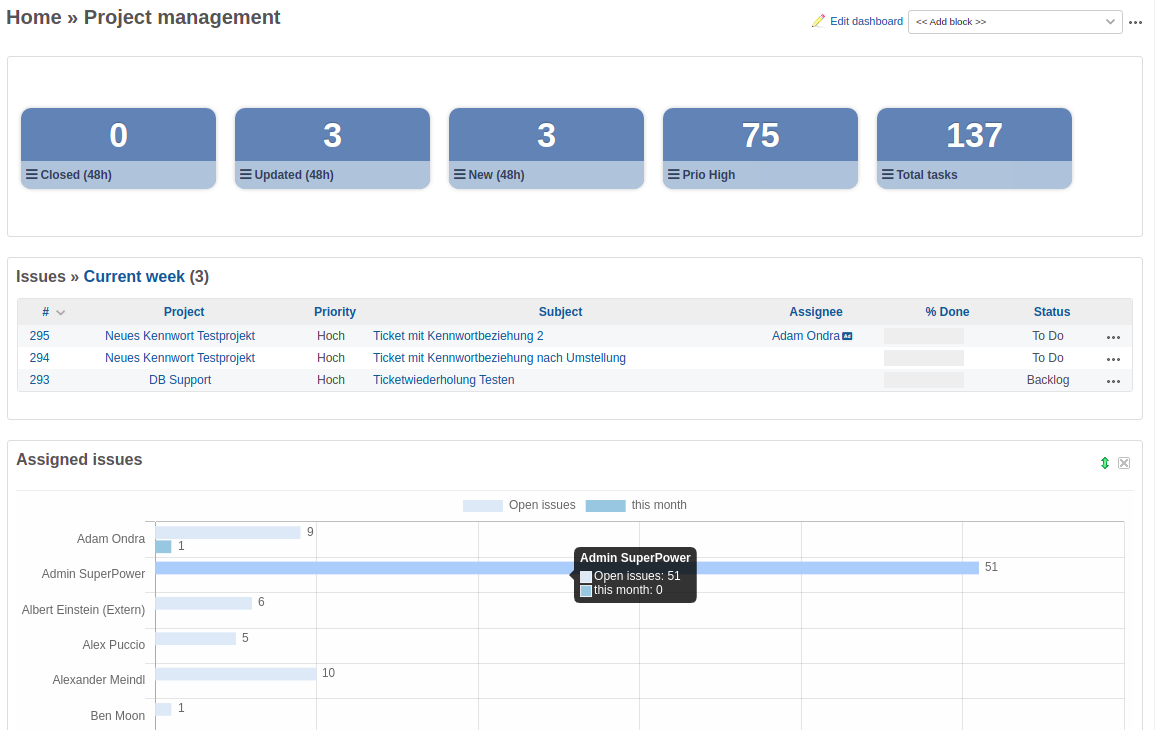
Your own dashboard with important key figures for the tasks of your team provides you with a quick overview.
Requirements for a dashboard with graphical analysis and key numbers box:
- current Redmine version
- current Redmine Reporting Plugin
- User with appropriate role rights to create custom ticket queries and own dashboard (e.g. administrator)
Create your own dashboard for the Redmine Home Page
As a user with the appropriate permission you have the possibility to create your own dashboard for the Redmine start page. The first step is as follows.
- open the Redmine start page.
- click on New Dashboard in the Dashboard menu.
- give it a name, a description. Set the visibility (e.g. only for you).
- save your new dashboard.
In the second step, you fill the newly created dashboard with information relevant to you. This is where the dashboard blocks come in. For a project management dashboard like in our example, you select the following dashboard block:
- Chart: Assigned issues
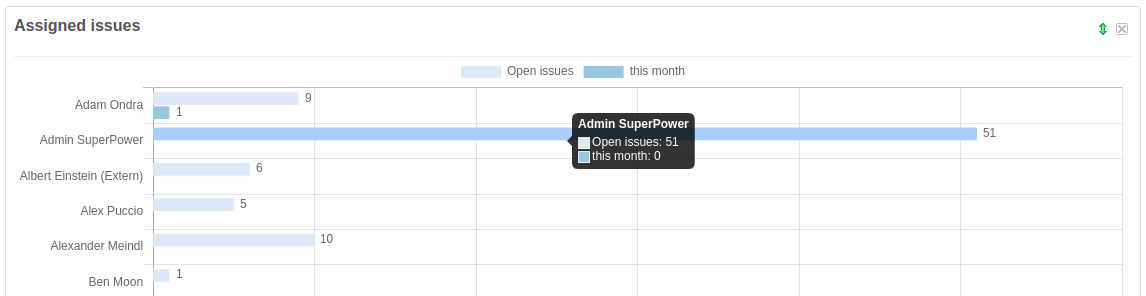
The graphics are clickable and redirect you directly to the tasks of the respective user.
Create custom issue queries
If you haven’t created custom queries on your team’s issue prefixes yet, now is the time to do so. In our example, we want to get an overview of the last 2 days. For this, we have created custom issue queries with the following filter options:
- Issue prefixes that were closed in the last 2 days.
- Issues prefixes that have been updated in the last 2 days
- Issues prefixes that were newly created in the last 2 days
- High priority issue prefixes
- Total number of issue prefixes assigned to my team
- Issues prefixes that have been processed in the current week
In order to display the necessary key numbers in the dashboard, make sure that you activate the Enable counter box option in the Counter box section when saving the custom queries. As well as select a suitable query group and enter the necessary information there.
Now you are ready to finalize your dashboard for the Redmine home page.
Customize Home Page Dashboard
Go back to your personal Redmine Home page dashboard. Here you can also choose from the custom queries you just created. Now add the following dashboard blocks:
- Query groups
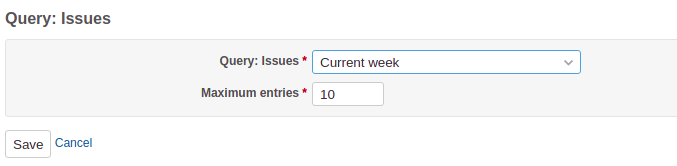
- Issue query (here, the custom query Issues processed in the current week is selected).
Custom queries (e.g. on issue prefixes) can also be added as a dashboard block.
The reporting plugin provides some important macros that are also useful for this use case. Macros can be used not only in the description field of a ticket or on a wiki page, but also within a dashboard block of type text, as well as text (asynchronous). Useful here, for example, is the query_counter(ID, issue) macro for displaying individual counter boxes. Independent of the query groups.
That’s it. In the plugin help you can find detailed information about the individual reporting dashboard blocks, as well as the counter boxes and query groups. Without the reporting plugin, you can also use the dashboard function for ticket lists. You need the free plugin Additionals for this.
This is available for download on GitHub. Graphical evaluations and key figures cannot be mapped with it. But you can put together your own start page dashboard and use ticket queries for this. This way, you can already get to know the dashboard function.
For whom?
The Redmine Reporting plugin is suitable for companies with cross-functional IT and business teams. Especially if they use Redmine as a project management tool and are looking for a way to get even more information out of it. Whether it is to facilitate decision making, or to create additional reports and graphical evaluations that provide a better project insight.
All information about our extensions for Redmine is available on the product page. The commercial Automation plugin is available in a cheaper bundle. It requires the Reporting Plugin. Customers whose Redmine does not meet the minimum requirements or who prefer to hire someone to install and regularly maintain their Redmine instance have the alternative to book our Managed Application Hosting for Redmine. Here, the plugin is already part of our hosting offering. The functionality can be tested extensively in our online demo.