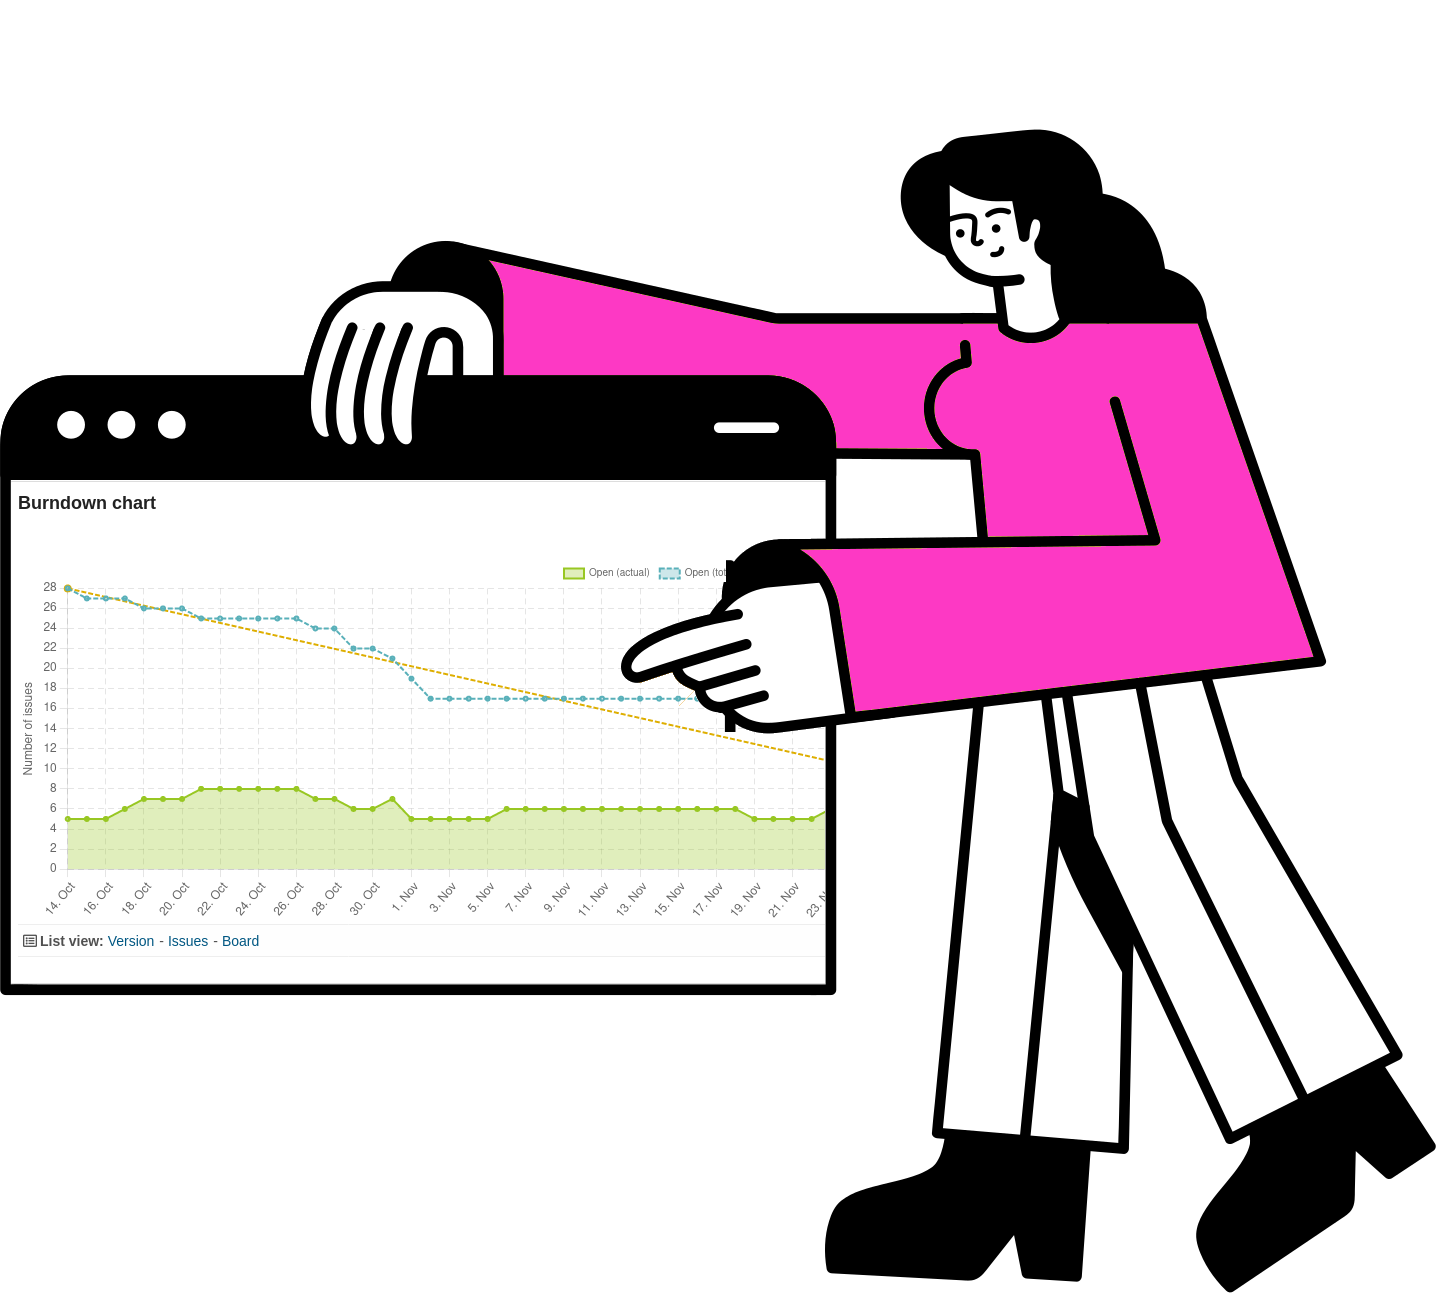
Redmine Reporting / Burndown Chart
What to use Burndown Charts for?
Burndown charts measure how much work remains to be done on a project. Burndown charts help you predict how likely it is that your team will be able to complete their work in the time available or will not meet the goal.
Keep track of project execution and watch progress in an easy way.
The time frame is defined in Redmine with the help of a version. This is because the version can be assigned a start date and an end date. Whereby individual tasks are assigned to a version and have to be processed within this time frame.
If the version is assigned to an issue, it is clear within which time frame the task has to be completed. The burndown diagram for a version thus provides you with:
- an overview of the task volume in the defined time period.
- it shows you the current progress
- it informs you whether your team has reached the set target (task volume or amount of hours) within the version:
- possibly not reached,
- ideally even reached early,
- or has long since exceeded
Working with a Burndown Chart requires regular (daily) issue updates from your team members. Otherwise the changes will not be visible.
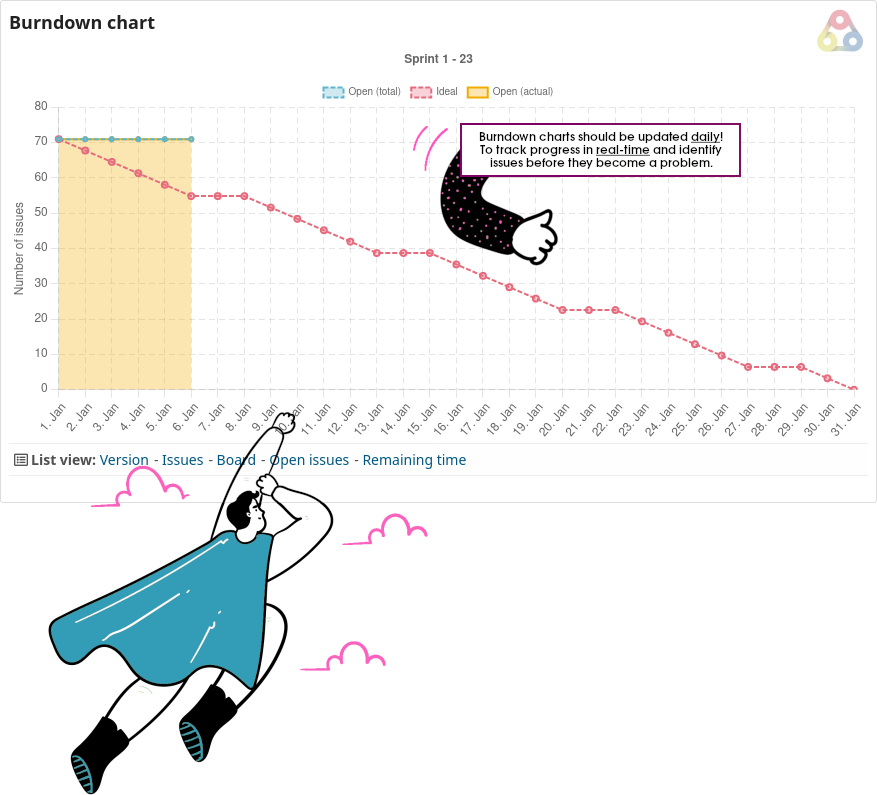
What does the Burndown Chart tell you?
The ideal line - which slopes from left to right and connects the start and end point of a version - is rarely accurate. But it helps to show the expected progress of the project in a simple way.
If the actual line Open (actual) is below the Ideal line, then good progress is made in working through the tasks. The goal will probably be reached early.
If one stays above the ideal line, then more tasks than expected are left open. It is rather unlikely that the task package will be completed within the expected time schedule.
What to do with the information?
If the burndown chart shows that your team may not reach the sprint goal in time you should take the necessary actions to stay on track.
Useful for
- Users who need a simple way to keep an eye on the progress on the team members’ work.
- Users who work agile and use fixed sprints (versions) for processing task packages.
- Users who are looking for a visualization of the workload within the time left for it.
- Users who want to keep their team motivated by showing their daily progress in a chart.
The Redmine Integration Redmine Reporting Plugin provides you with valuable information to make your projects more successful. The burndown visualization helps in any case to monitor the processing of work packages and to analyze possible delays. In order to use the Burndown Chart, it must be activated by a user with administrator permission.
Good to know about Burndown charts
Burndown charts of the Reporting Plugin can be used flexibly:
- If you activate the chart you can see it in the project roadmap for each version.
- You can add it as Dashboard block to your project overview page.
- Depending on your issue settings if issues from sub projects are included you will be able to see those issues in the chart of a parent project, as well.
- Burndown charts are popular with many teams. They work well on projects where not many changes occur during the time frame.
- The Reporting plugin Burndown Chart can be used for amount of issues or estimated hours on issues
- In any case your team needs to update their issues regulary once a day to make the actual situation visible
- Depending on your usage the Burndown chart will change if you change the status of an issue to Closed or if you work with the issue progress %done to make the remaining time visible.
Business value: Information at your finger tips.
It is important for companies to be able to identify problems at an early stage and take countermeasures. The use of Burndown charts is just one of the many useful plugin features of the Reporting Plugin. The plugin is available individually or in a bundle with other plugins that further extend the functionality of your Redmine. You can test the function in our free available online demo.
Availability of Burndown chart for versions: Part of the current version
Buy Reporting Plugin v4.5.0
Affordable prices regardless of your team size