Redmine Reporting / Reports and Dashboards
How to work with dashboard reports for Redmine
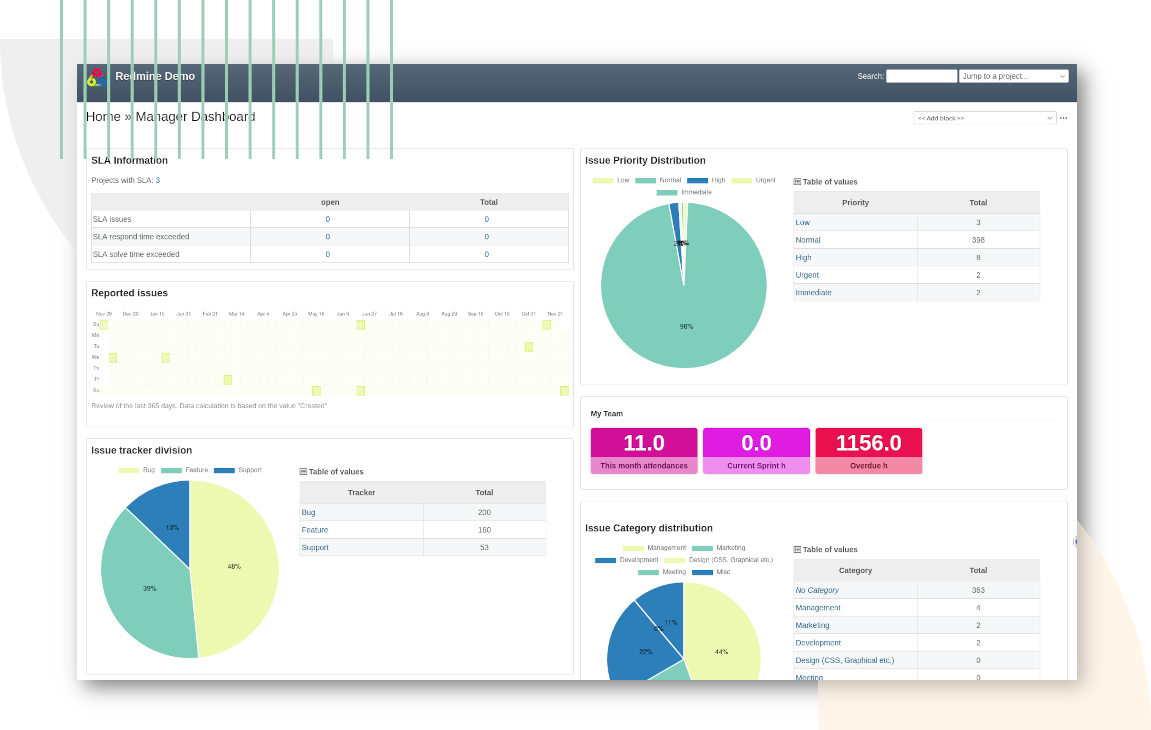
Redmine Reporting provides, among other features, first-class project and team reports that give a quick picture of the current status. Integrate them directly into your standard dashboard. Or create your own dashboard for the relevant analyses of your project.
Optimize projects
The more you know about your projects and your team, the easier it is for you to make the right decisions or find solutions. Our built-in reports and graphical analysis help break down the data. They give you the insights you need to see what works well and where.
The Redmine integration Redmine Reporting Plugin provides you with valuable information to manage your projects more successfully. Track the performance of your team, learn to better understand relevant aspects of your projects and see how the work is going or if there are bottlenecks.
Access relevant project data centrally
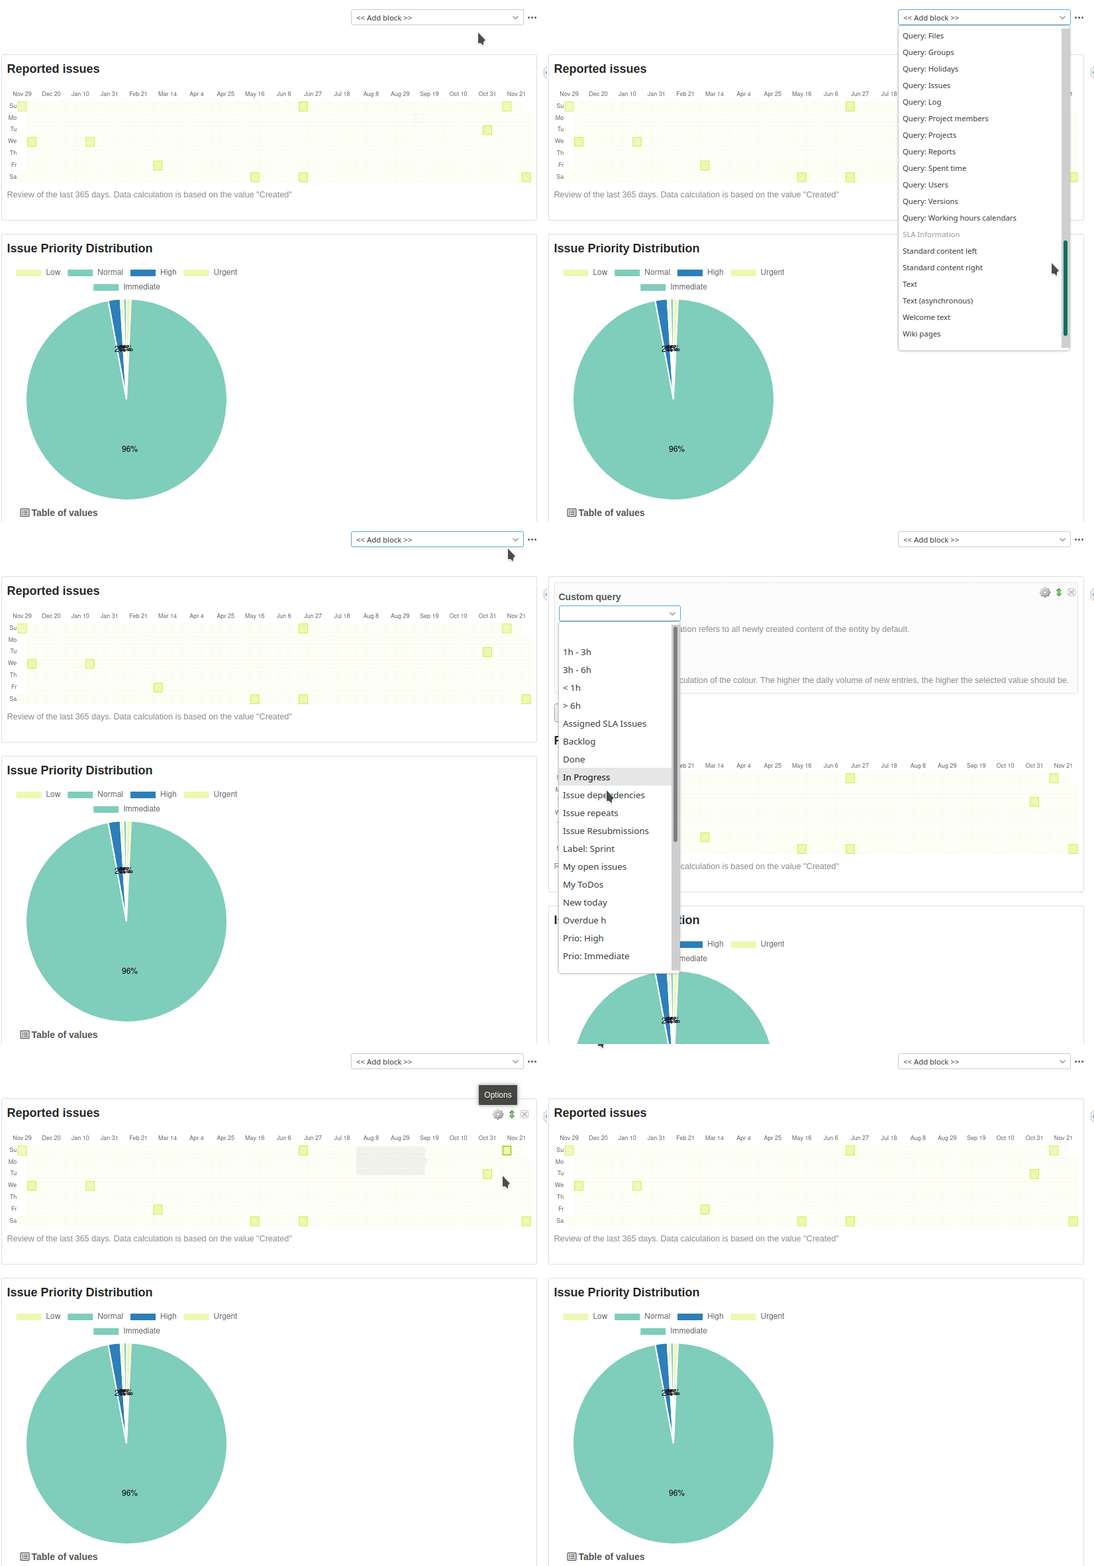
You can find the project data where it is relevant for you and your users. One look at the real-time evaluations and you know the current status. Integrate the graphics or reports simply by using the dashboard block. The different reports can be placed on the Redmine start page as well as on the project overview page.
Provide more data to your team
Give your team a tool that allows them more flexible access to the data relevant to them. Filters and options enable individual reports and evaluations. Dashboards can be created role-based. Ideal when different teams need to work with it. For example, departments, regions, project teams, stakeholders.
Monitor the ROI of your projects
From budgeting to creating business reports, the plugin helps you keep track of costs and project expenses in relation to the financial value of your job.
Good to know:
- Dashboard blocks to the graphics and evaluations project-related and cross-project usable
- Various export formats available for reports: CSV, XLSX, PDF
- Interactive graphics that work with real-time data
- Extension of the Redmine data fields for improved evaluation possibilities
The reporting plugin prepares all data visually. You get additional filter options and calculations for key figure analysis and individual evaluation.
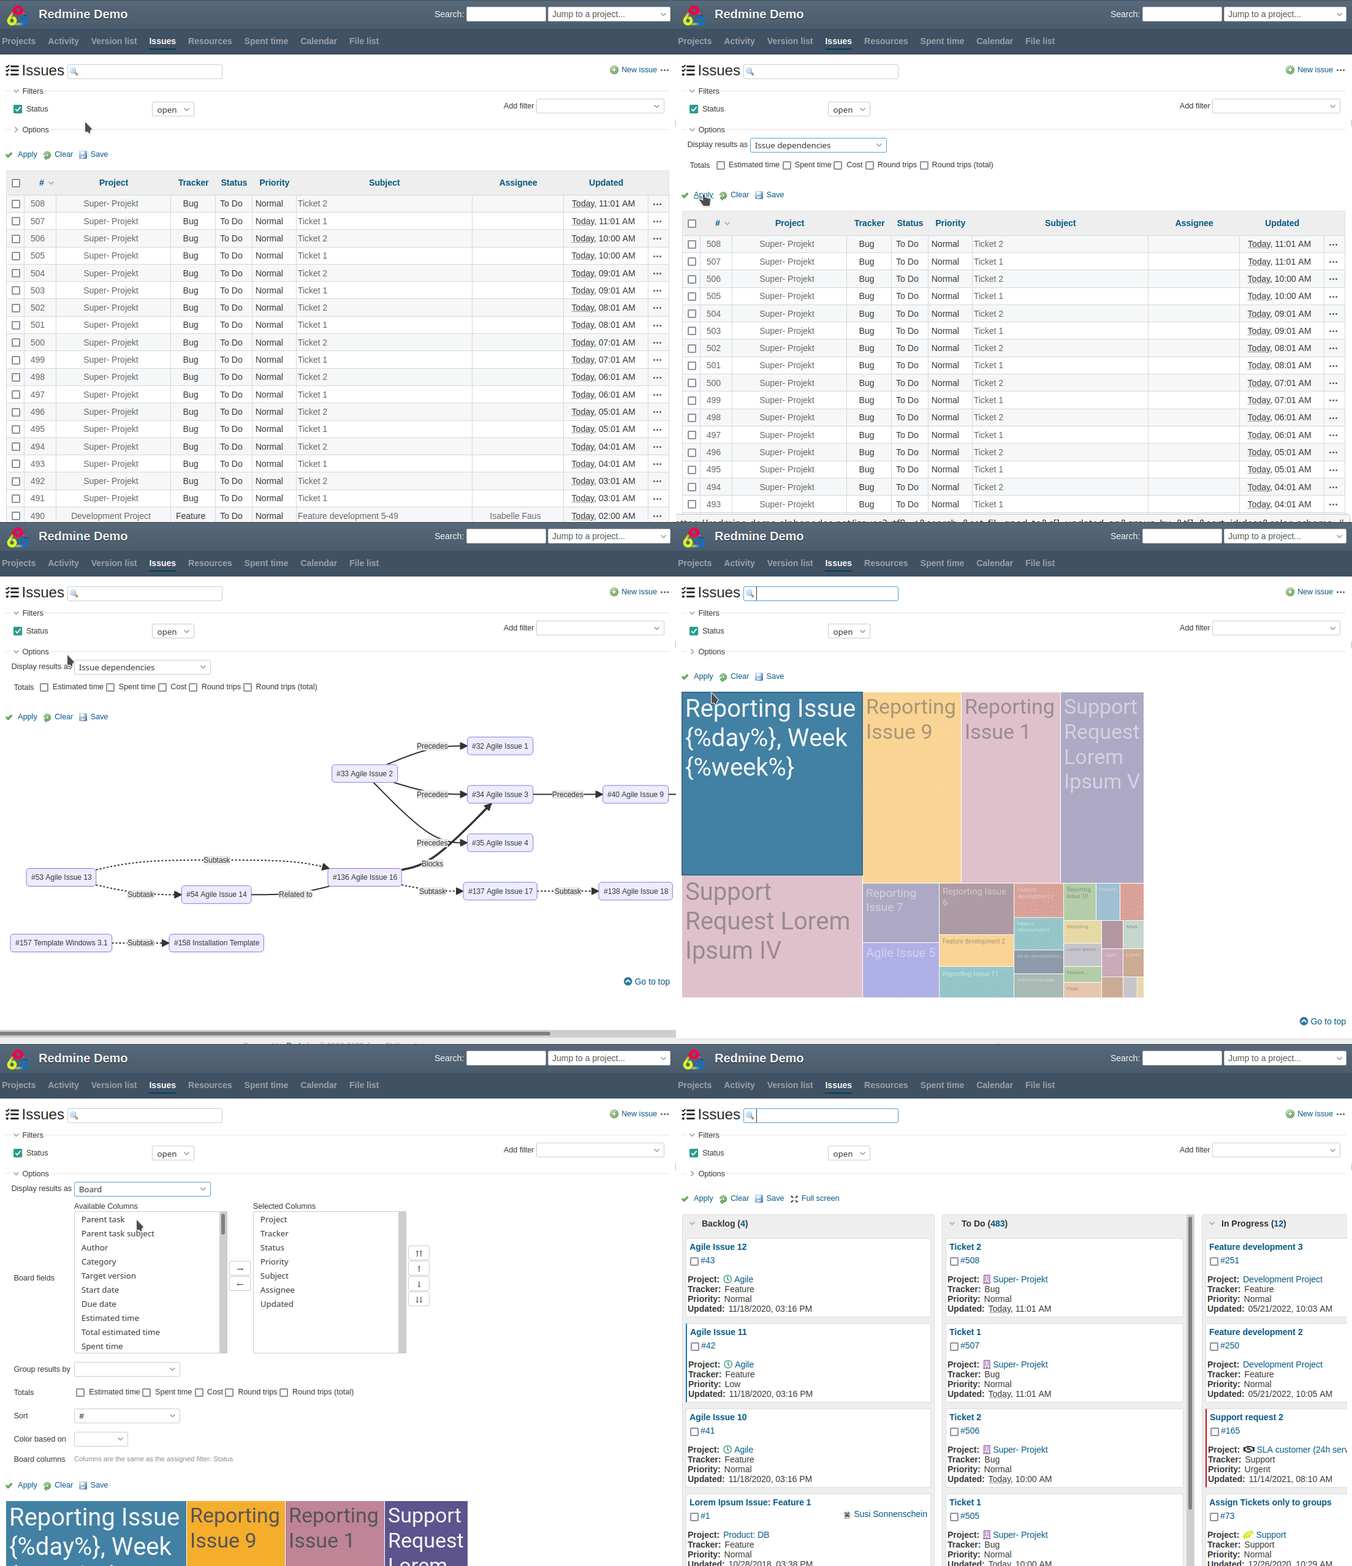
Improved Redmine issue list
Redmine provides a general Issues list to show all issues within a project and also cross-project (if globally accessed). The issue list can be sorted and filtered accordingly. When using Redmine Reporting you get an improved Redmine issue list with a lot more information to display and other visualisations to view.
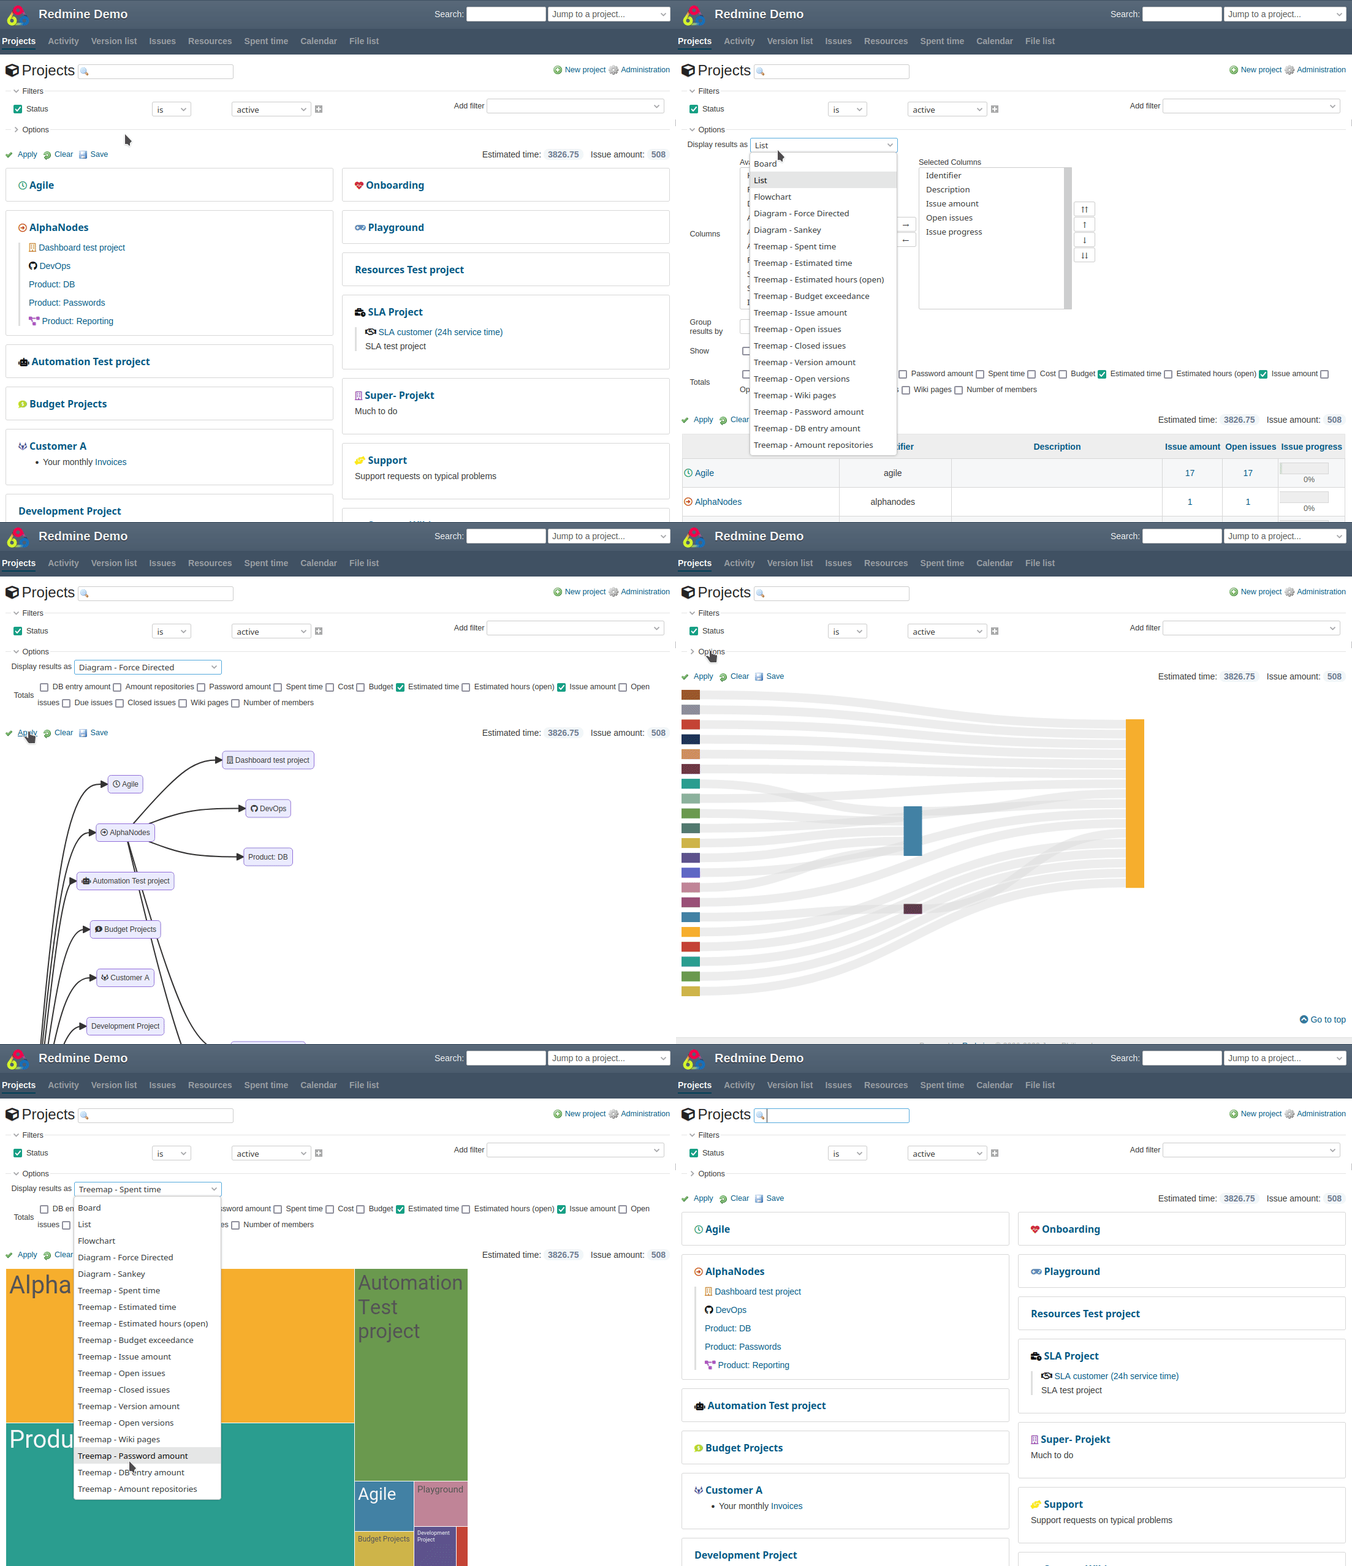
Improved Redmine project list
The global project list of Redmine shows all projects you are assigned as member to. The project list can be sorted and filtered accordingly. When using Redmine Reporting plugin you can get much more information out of the project list then usually. In addition to numerous optional display options, the project list can be transformed into an informative report that provides important project metrics with the help of additional columns.
Business value: Information at your finger tips.
It is important for companies to be able to identify problems at an early stage and take countermeasures. The implementation of graphics and additional evaluations, as well as the dashboard support is only one of the many useful plugin functions of the Reporting Plugin. The plugin is available individually or in a bundle with other plugins, which further extend the functionality of your Redmine. Availability Reports & Graphs: Part of current version
Buy Reporting Plugin v4.3.0
Affordable prices regardless of your team size


