Redmine Products / Best Redmine Reporting Charts
Reports are important to ensure that a project runs successfully and to identify project risks at an early stage. The following graphic evaluations of the Redmine Reporting Plugin help you with this. We recommend to test the functionality in our online demo.
Chart Guide for Redmine Reporting
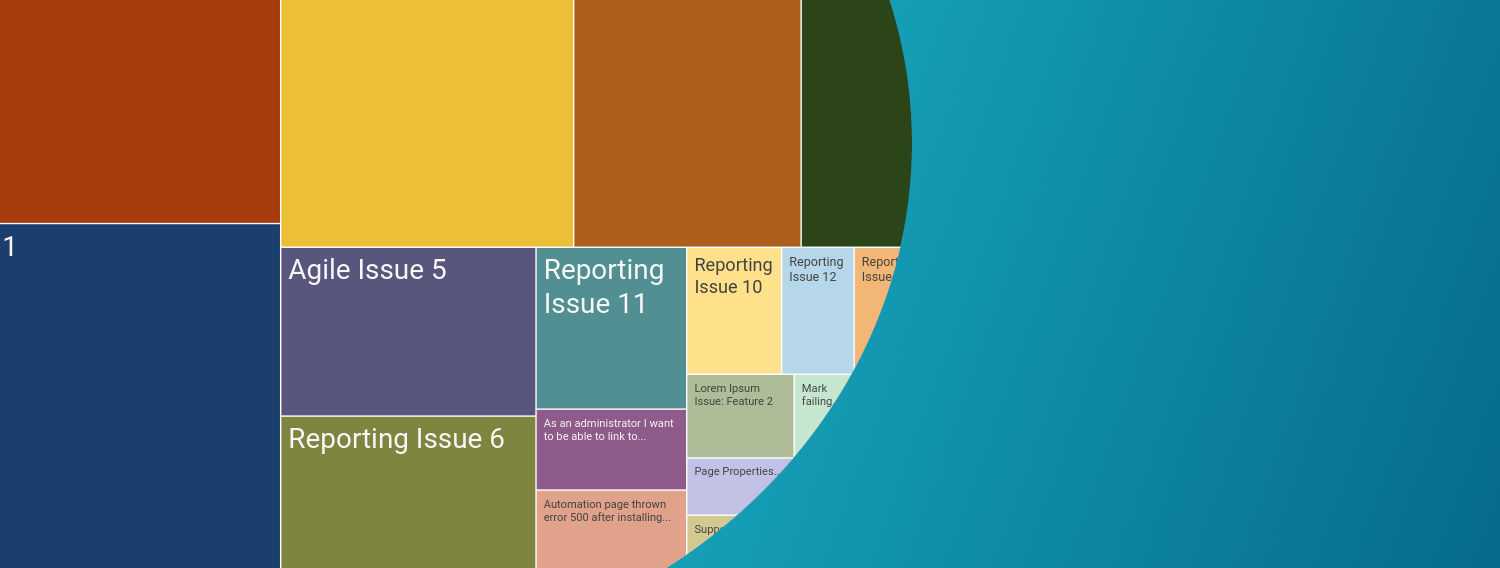
Treemaps
Treemap charts are perfect for displaying hierarchical data in a simple and space-saving way. Treemaps are used in various areas of the Reporting Plugin: Project list, Version list, File list, New: Issue list
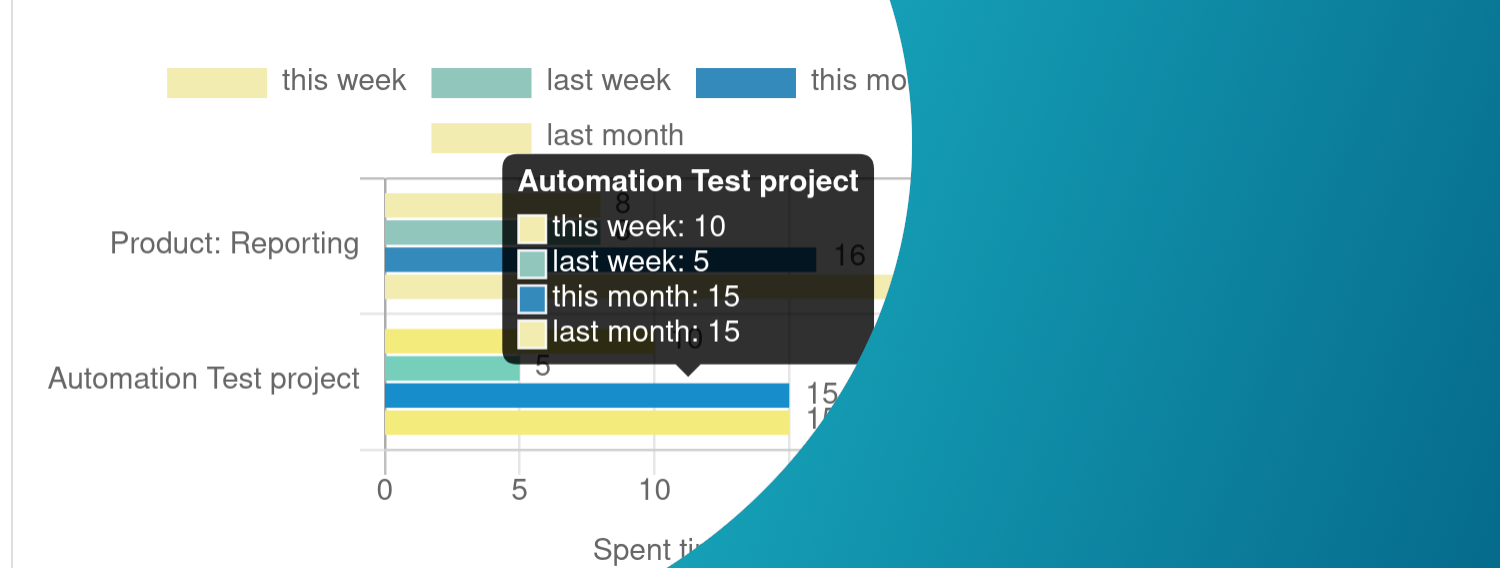
Bar charts
Vertical and horizontal bar charts for data comparison are used in various areas of the Reporting Plugin: Dashboard blocks of Redmine Home page, Dashboard blocks of Project overview page, Dashboard blocks of HRM overview, History lists for various issue parameters (Status, Priority, Assignee, %Done, Estimated time)
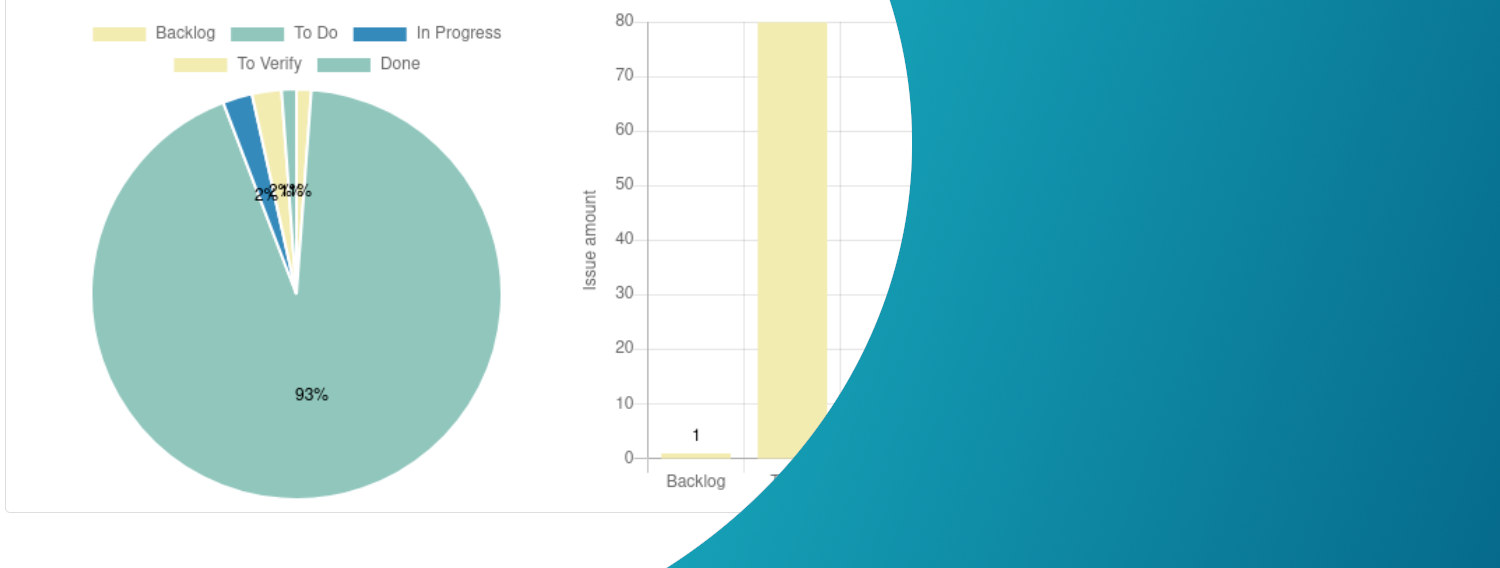
Pie charts
Pie charts are commonly used visualizations to get a general sense of single project segments in projects (e.g. issue related). They are used in various areas of the Reporting Plugin: Dashboard blocks of Redmine Home page, Dashboard blocks of Project overview page
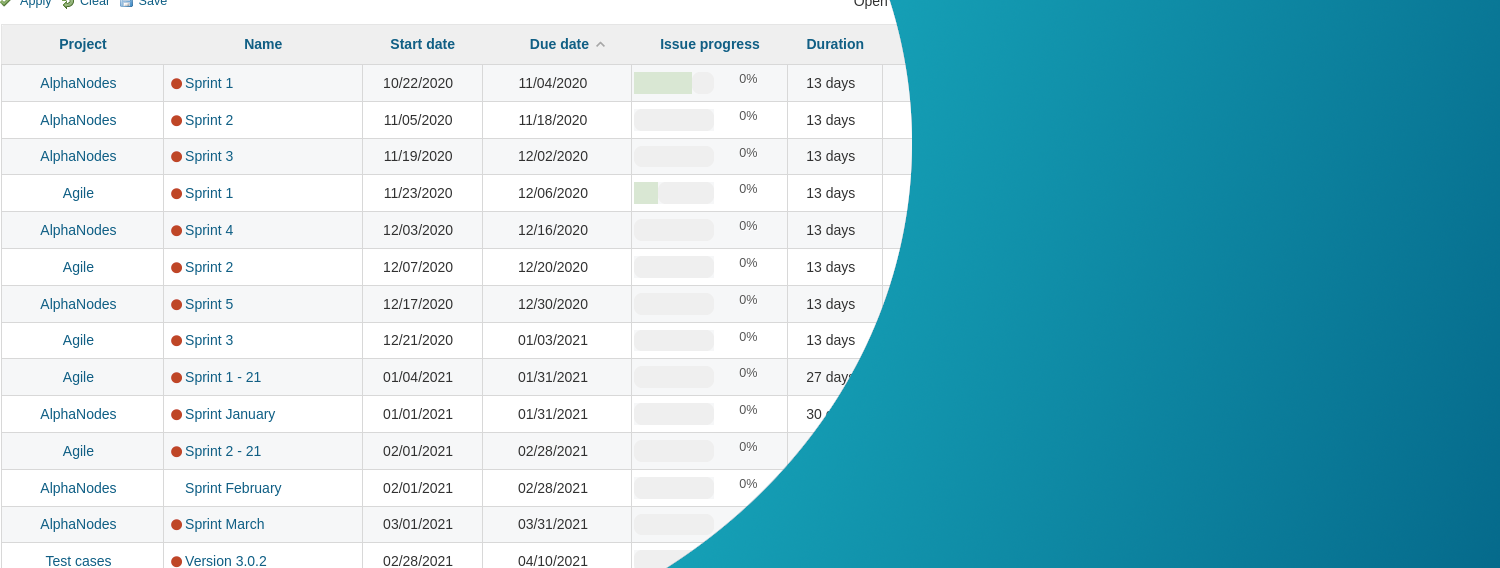
Data tables
Data tables are used in various areas of the Reporting Plugin: Project list, Version list, File list, Dashboard blocks of Redmine Home page, Dashboard blocks of Project overview page
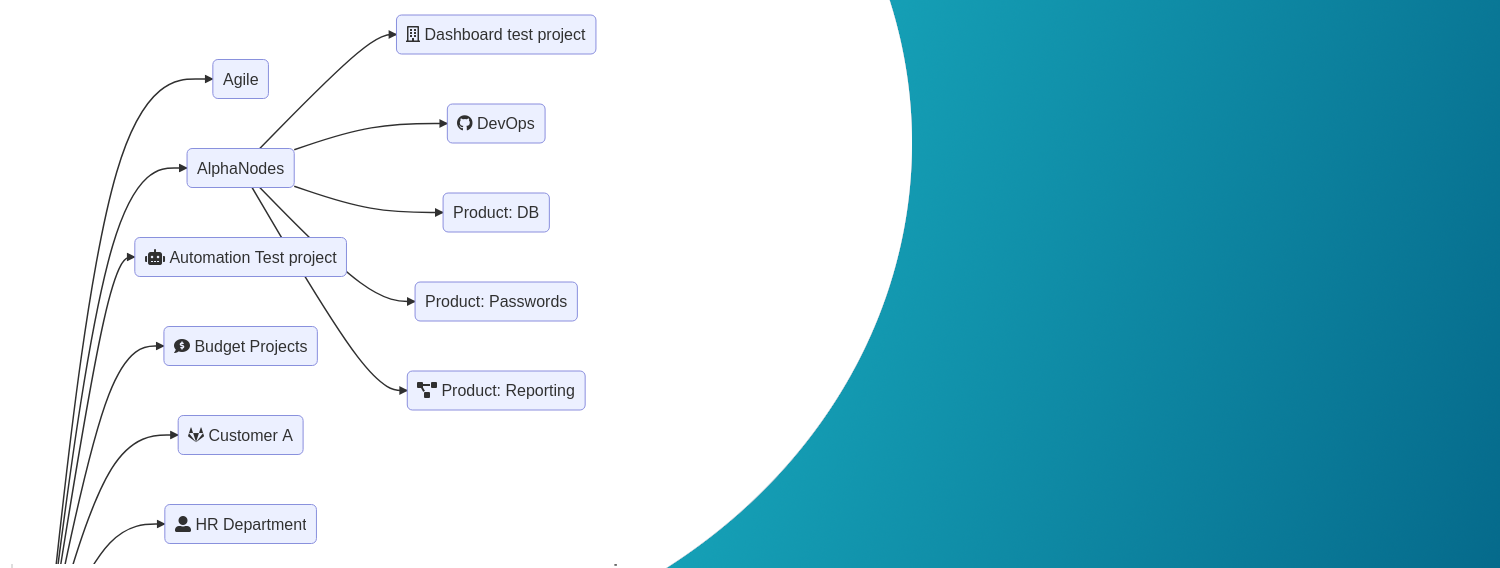
Flowchart
Flowcharts (Mermaid) are used in various areas of the Reporting Plugin: Project list, Issue list for issue dependencies, Workflow visualization, New in v4.2.0: Version list and project list as time sequence
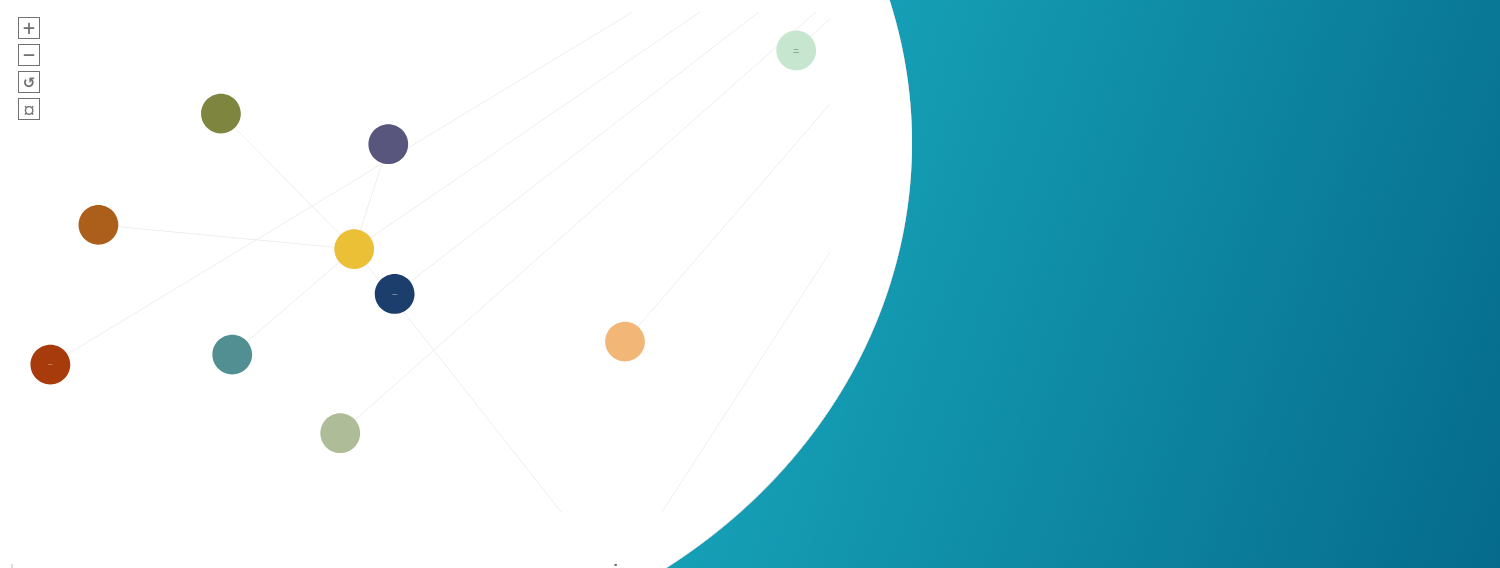
Diagram - Force Directed
A Force Directed Diagram is a clustered graphical structure of the project connections (single nodes) and it is used in the project list of the Reporting Plugin.
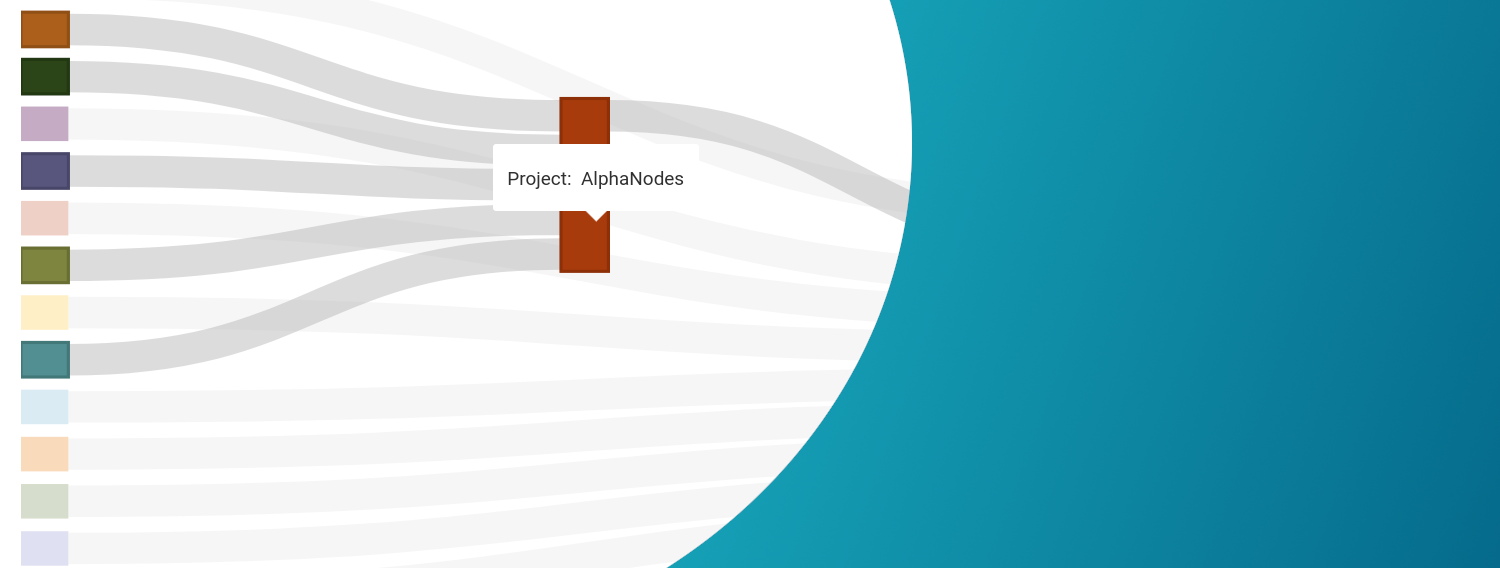
Diagram - Sankey
A Sankey Diagram is a type of flow diagram, which is used in the project list of the Reporting Plugin. You see how the projects are connected with each other.
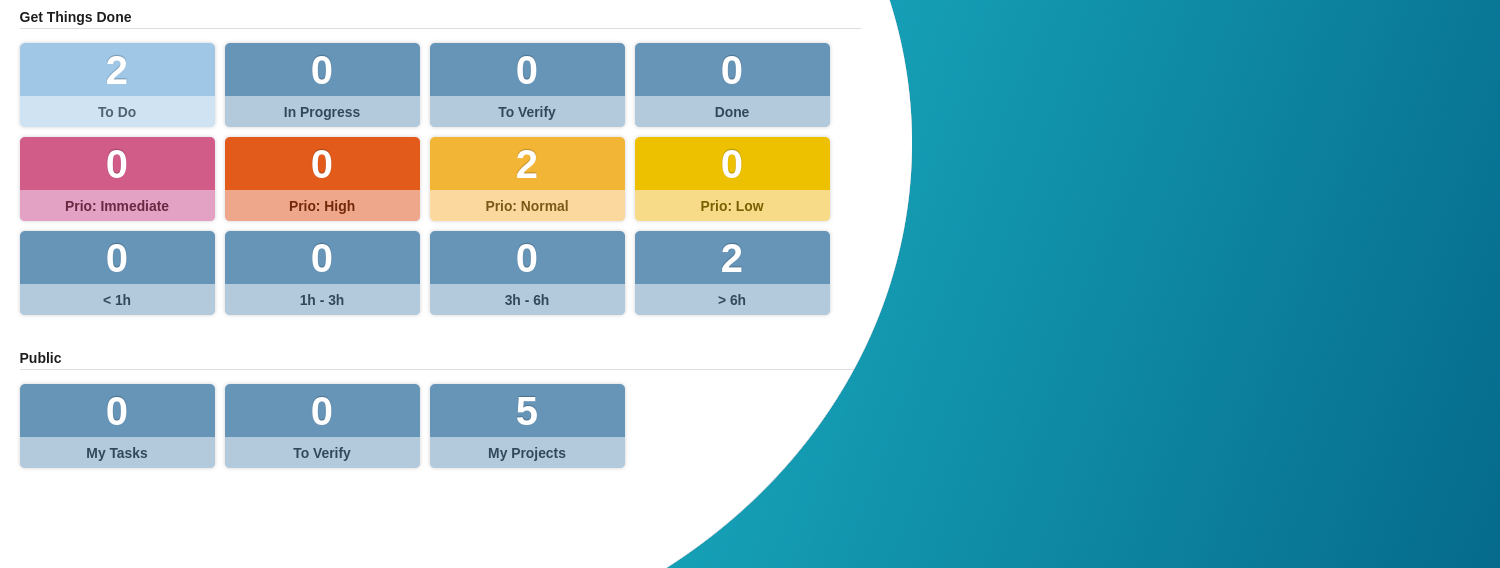
Counter boxes
Counter boxes output the number of custom queries, which are linked behind them. They are used to draw attention to certain metrics and jump to certain areas. Counter boxes are used in various areas of the Reporting Plugin: Dashboard blocks of Redmine Home page, Dashboard blocks of Project overview page
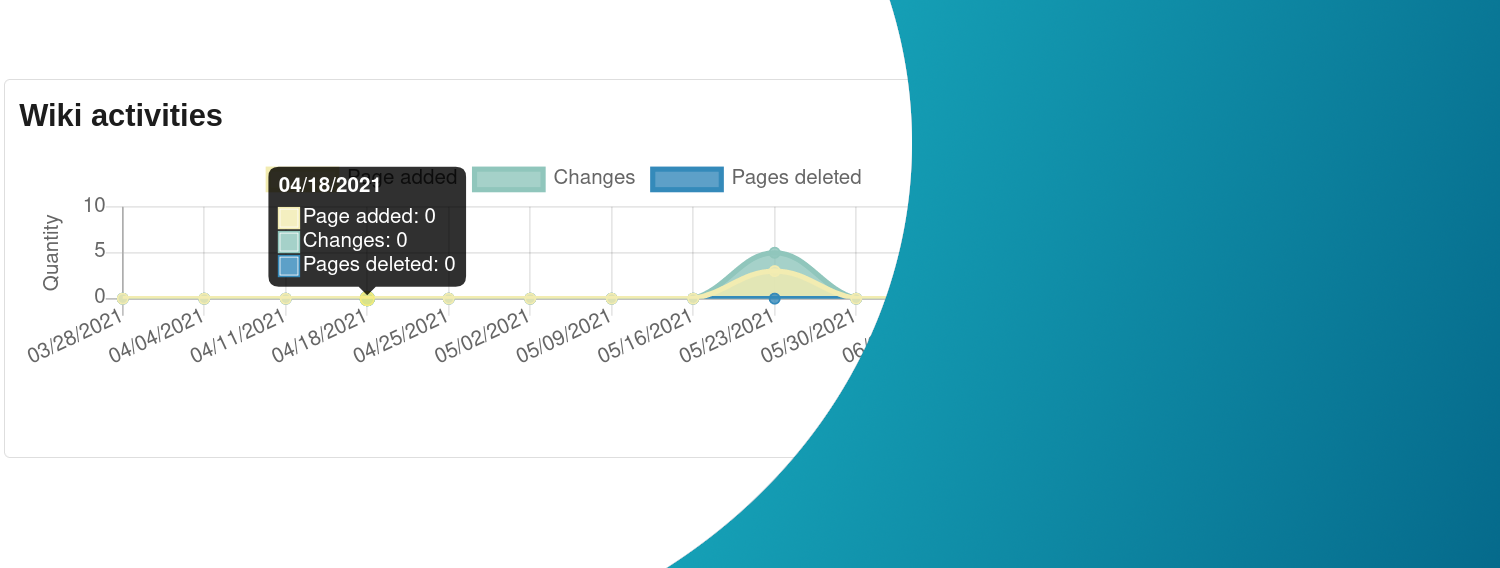
Line graphs
Line graphs show changes over time. They are used for wiki activities in Redmine projects and part of the Reporting Plugin area: Dashboard block of Redmine Home page, Dashboard block of Project overview page
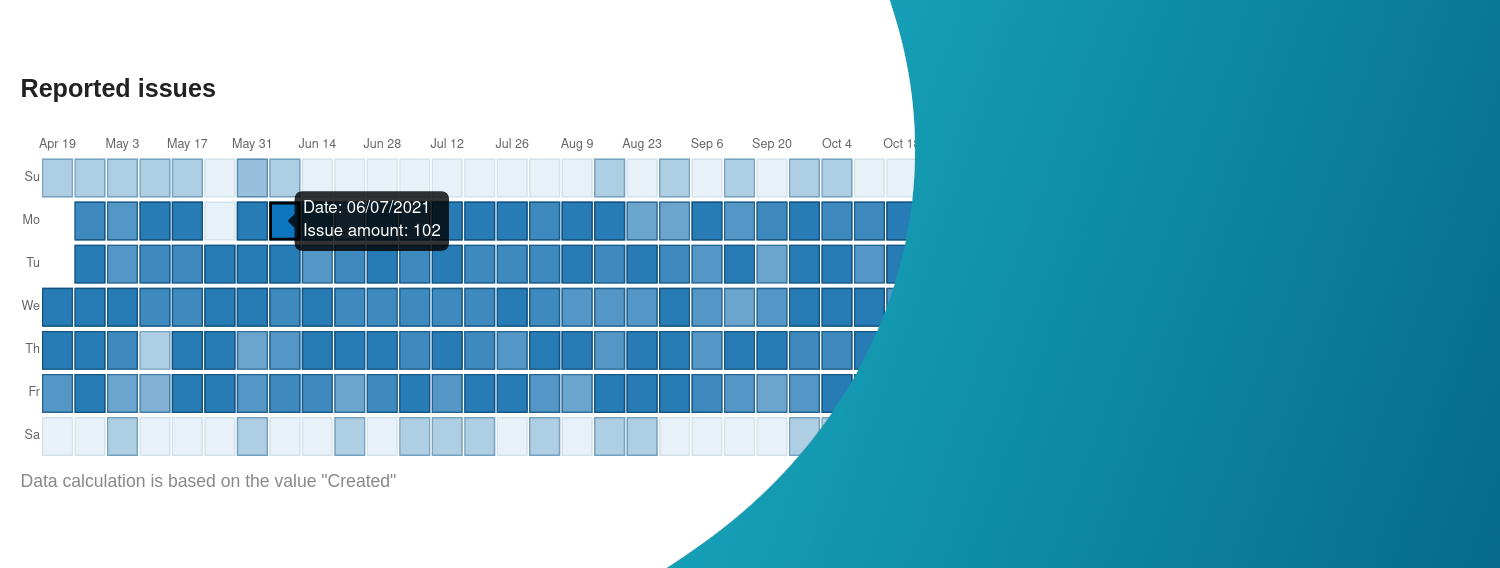
Matrix graphs
The Matrix graph shows new contributions of various entities over the past 365 days in form of coloured blocks. You can add the dashboard blocks to various areas of the Redmine overview page, the Redmine Home page or HRM overview page.
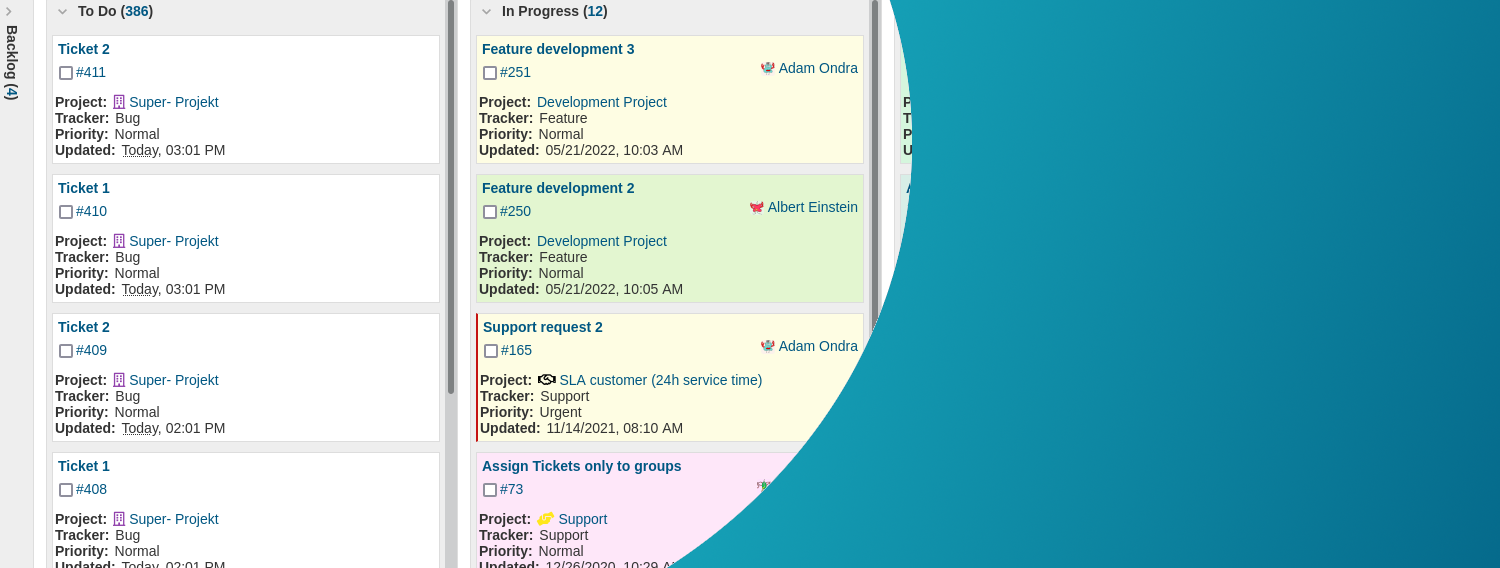
Task Board
With the Reporting plugin v3.0.8 a new chart was inroduced. Task board view for issues. Simply turn the ticket list into a board, with the status information corresponding to the board columns. The task board view is selectable in the issue list (project-related and cross-project).
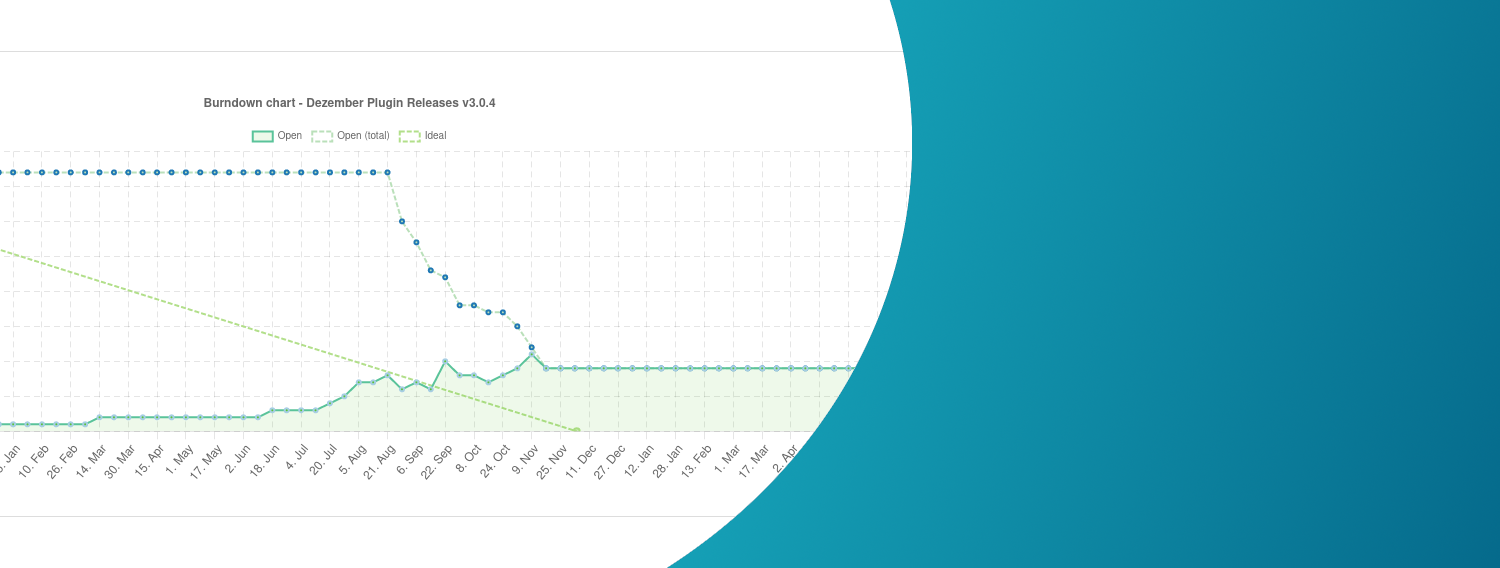
Burndown Chart
Burndown chart for versions based on number of issues. Use the Burndown Chart as a tool to help your team take control of their work, take responsibility. The chart helps you track the progress of the sprint. It can be integrated in the following areas of the Reporting plugin: Roadmap / Version (below issues), Project overview (dashboard block)
The graphic output is predefined for the individual areas. Usually, most of the information in the graph is linked to the displayed area. Users with the appropriate permission simply add the diagrams to the respective dashboard by selecting the dashboard block.
Improve productivity. Accelerate goals. Make your team happy.
Our goal is to deliver a high quality product with real added value to demanding customers. Change your daily work with Redmine, now.