
The Reporting plugin version 3.0.8 is an add-on for the open source project management tool Redmine v5 or higher. It provides a burndown chart for agile teams to check the sprint progress.
The burndown chart is a graphical representation of the remaining tickets in a project in relation to the remaining time. The burndown chart shows you the amount of work to be done in a sprint.
When to use a burndown chart?
It can be used to track the total work remaining in the Sprint and forecast the likelihood of reaching the Sprint goal. By tracking the remaining work during the sprint, your team can manage its progress and respond to trends accordingly.
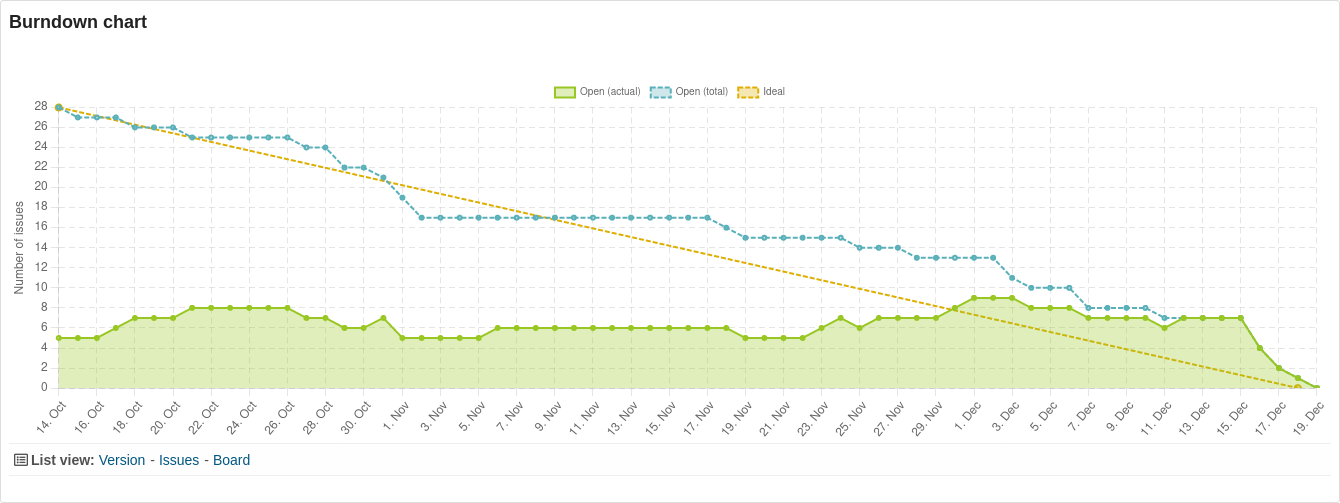 Example: Project Dashboard Block with a Burndown Chart to the Current Version
Components:
- X-axis: Timeline of the version
- Y-axis: Task volume / number of hours
- Ideal (Is): Ideal number of open issues / open hours
- Open (actual): Actual number of open issues / open hours.
- Open (total): Number of open tickets / open hours related to all issues assigned to the version.
What does the Burndown Chart inform you about?
The burndown chart shows whether or not a project team is meeting the planned sprint goal. A sprint is a short, time-limited period of time during which teams work to complete the defined scope of work.
In Redmine, versions are used for this purpose. For a version in Redmine, you can store both a start date and an end date with the help of the Reporting plugin.
If the version is assigned to an issue, it is clear within which time frame the task has to be completed. A version usually consists of several issues that have to be completed within the defined period of time.
The burndown diagram for a version thus provides you with:
- an overview of the task volume in the defined time period.
- it shows you the current progress
- it informs you whether your team has reached the set target (task volume) within the version:
- possibly not reached,
- ideally even reached early,
- or has long since exceeded
The ideal line which slopes from left to right and connects the start and end point of a version is rarely accurate. But it helps to show the expected progress of the project in a simple way.
If the actual line Open (actual) is below the ideal line, then good progress is made in working through the tasks. The goal will probably be reached early.
If one stays above the ideal line, then more tasks than expected are left open. It is rather unlikely that the task package will be completed within the expected time schedule.
Useful for
- Users who work agile and use fixed sprints (versions) for processing task packages.
- Users who are looking for a visualization of the workload within the time left for it.
Here you can find the burndown chart of the reporting plugin.
The graphical visualization is implemented in the following areas, if the function has been activated:
Version: Here you can find the visualization at the end of the ticket list for a version. Retrievable within a project via the roadmap and when calling up the desired version. Alternatively, also via the global version list by selecting the desired version there.
Project dashboard: Here, the version defined by default for a project can be added as a dashboard block.
Users with the appropriate authorization select the Dashboard Block Chart: Burndown Chart for this purpose.
Users who have access to the roadmap within a project will also see the burndown chart below the version list when this feature is enabled.
How to activate the burndown visualization
In order to use the Burndown Chart, it must be activated by a user with administrator permission.
Plugin configuration: Go to Plugins / Redmine Reporting / General and activate the respective option in the Issues area. In addition, you can also set whether weekends should be taken into account.
By the way, the color scheme is not fixed, but is also controlled by the Reporting plugin. Here you can assign an available color theme for the graphical evaluations in the plugin settings.
Conclusion
The burndown visualization helps in any case to monitor the processing of work packages and to analyze possible delays. Originally, this chart is used primarily in agile project teams. However, it can be used for all projects that want to measure the project progress on a time basis.
All information about our extensions for Redmine can be found on the product page. The paid reporting plugin is available individually or in a bundle with additional functions. The functionality can be tested extensively in our online demo. From plugin version 3.0.8 it is also available for purchase. Our Redmine Managed Application Hosting customers can already use it now.