
If you already work with the Redmine Reporting Plugin from our company, you will get a number of charts and diagrams to display on the Redmine home page or project overview. They give you a pretty complete picture of the status of your projects, for example the tasks they contain.
The displayed diagrams can not only be configured according to your wishes. You can also specify if and where the graphical output is to take place and for which role.
That’s not enough for you yet? You may need certain information that is not captured by the standard graphs. Then it’s time to go deeper into your issue data. With custom fields in List format.
Create your first custom, graphical evaluation
If you use custom fields of the format list in the ticket evaluation area, you can have a pie chart with corresponding distribution output for the entered values.
And that’s how easy it works:
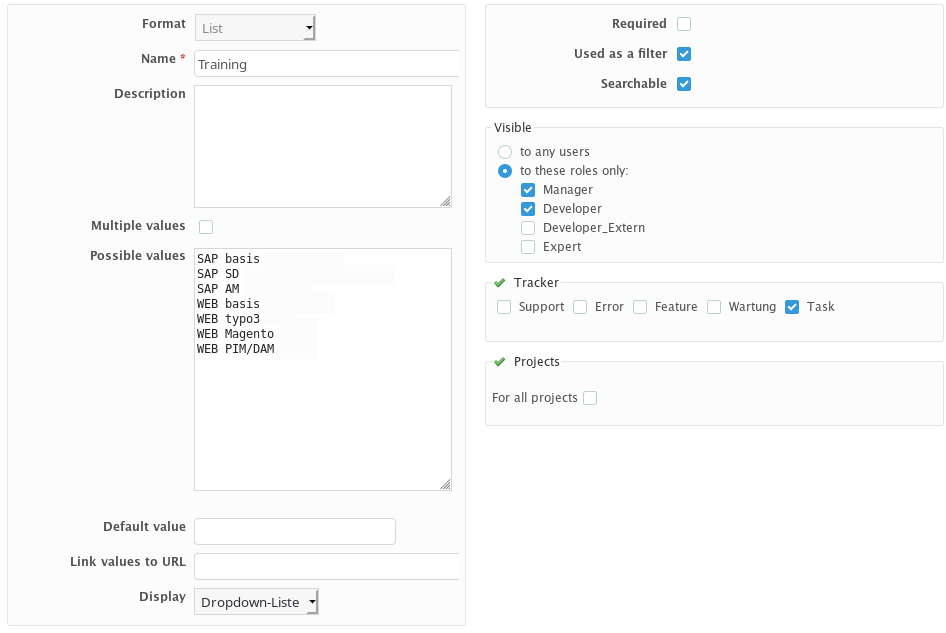
Step 1: Create a custom field with the format list in the administration area / custom fields for the issues.
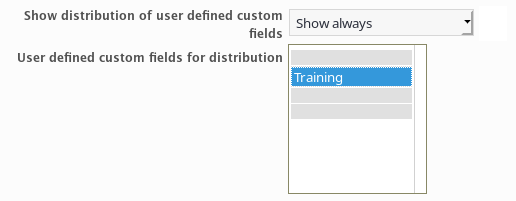
Step 2: In the plugin configuration area General activate the option Show distribution of user defined custom fields according to your requirements.
Then select the custom fields for deployment. Done.
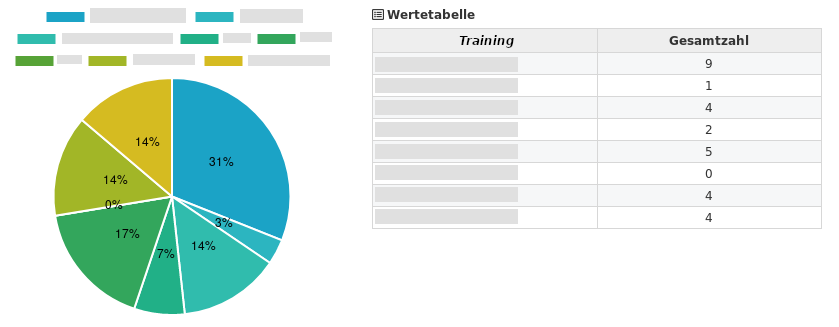
Step 3: Open the Redmine home page or project overview. Depending on the area for which you have activated the graphics. There you will find a graphical evaluation according to your entered values.
Note
- The Redmine Reporting Plugin can be used in a variety of ways and, in addition to predefined graphics, provides the possibility to output your own evaluations for user-defined fields.
- For the graphical evaluations to be displayed, at least one entry must exist for different values.
- The output of graphical evaluations for user-defined fields in list format described here is also implemented in the DB Plugin and works there as described here.
An overview of all Redmine plugins of AlphaNodes GmbH can be found on the product page. Further information about the Redmine Reporting Plugin can be found on the Plugin page. The functionality described here can be tested in the online demo.