
The Redmine Reporting Plugin not only contains numerous functions for creating graphical evaluations and reports for projects, tasks and project teams.
Various project views in Redmine
The following display options for a better project overview will be available to our plug-in and hosting customers in the future. They can be accessed in the Projects section Options and there under the drop-down list View.
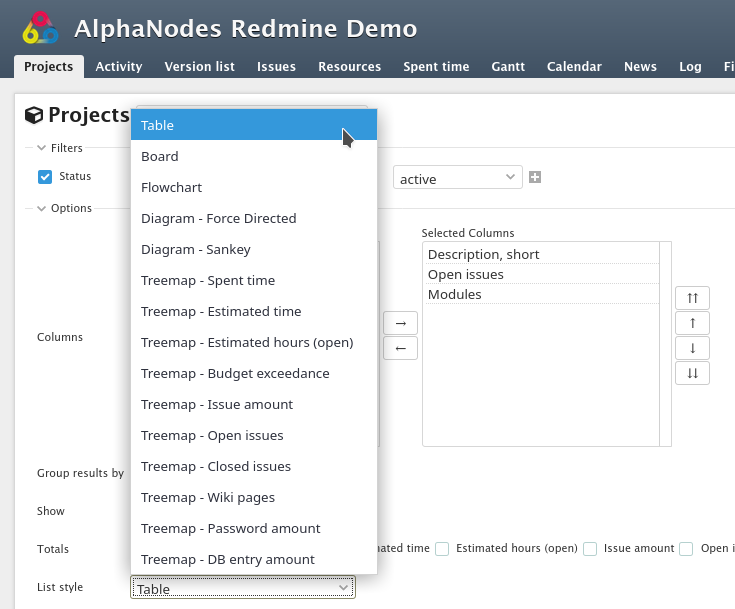
Figure shows various selection options for viewing projects in Redmine
Table view
The table view provides a better overview of existing projects in Redmine.
Through various filters and column options, as well as totals information, concrete details of time spent, costs, budget, tickets or other (e.g. user-defined) information can be entered and reports generated.
The table view is not only useful for a large number of projects, but also makes it easier for project managers to monitor the project status, costs and other key figures.
In addition, export to CSV, XLSX or PDF format is possible.
Board view
The previous, typical tile view of Redmine returns with this version. In a slightly adapted form, it can be used for a few projects.
However, from a certain number of projects on, the previously described table view is more recommendable due to the better clarity.
Flowchart
The new flowchart view of the projects is implemented with the help of the open source project Mermaid, which is already used with the Reporting Plugin in tickets and Wiki with the help of macros.
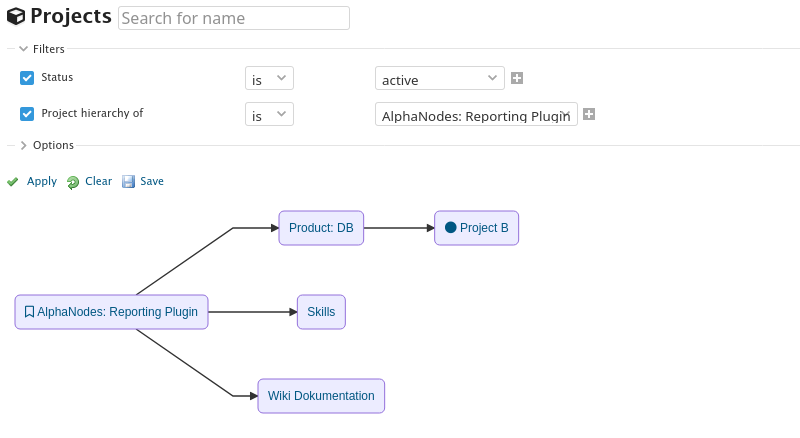
Presentation of the project overview or parts of it as a flowchart
For the first time, the flowchart view graphically shows the connection between the individual projects. Particularly with a large number of projects, the available filter options give you the possibilities of filtering:
- Subproject of
- Project hierarchy from
which are by the way, good presentation possibilities for certain project areas.
Mermaid has won the JS Open Source Award in the category The Most Exciting Use of Technology in 2019. And rightly so (in our opinion). At this point our congratulations from us for this great achievement.
Definition Flowchart: A flowchart is a type of diagram that represents a workflow or process. It presents the steps as boxes of various types and their sequence by connecting the boxes with arrows.
Diagram views: Force Directed and Sankey
The Sankey diagram is a good alternative to conventional flow or bar and pie charts. These types of diagrams draw attention to the largest entries in the system. Also here you can see very nicely the connections between the individual projects.
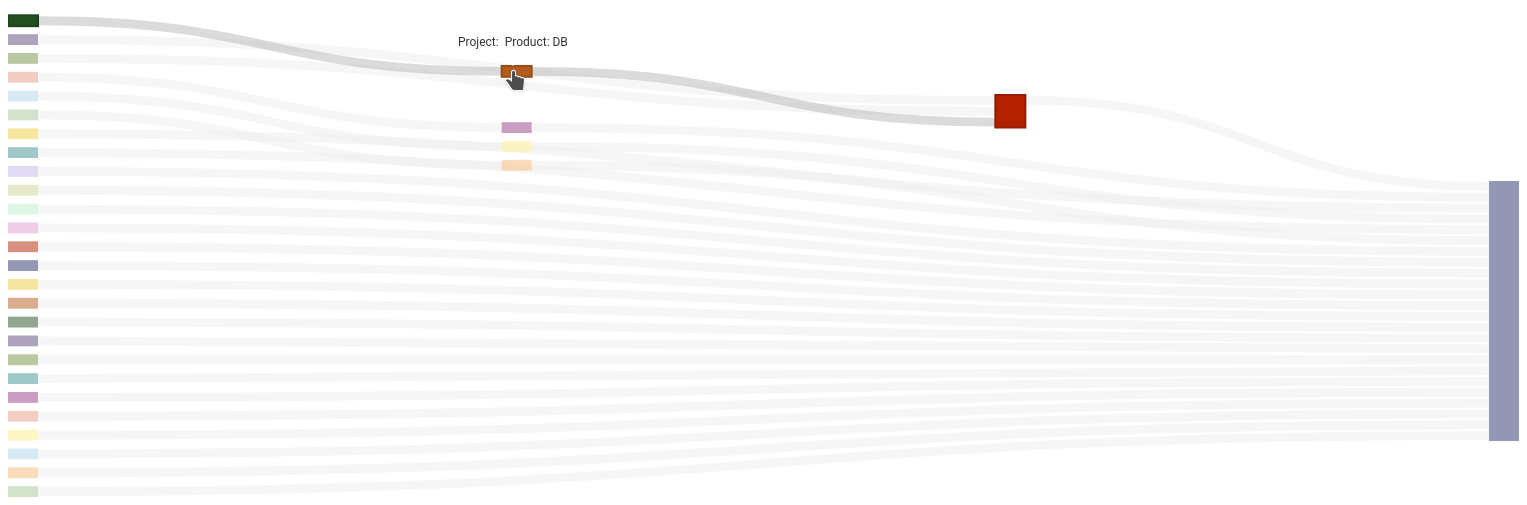
Representation of the projects or parts thereof as Sankey diagram
Another visualization technique is the use of Force Directed Graphs. Here, the diagrams are based on information contained in the structure of the diagram itself.
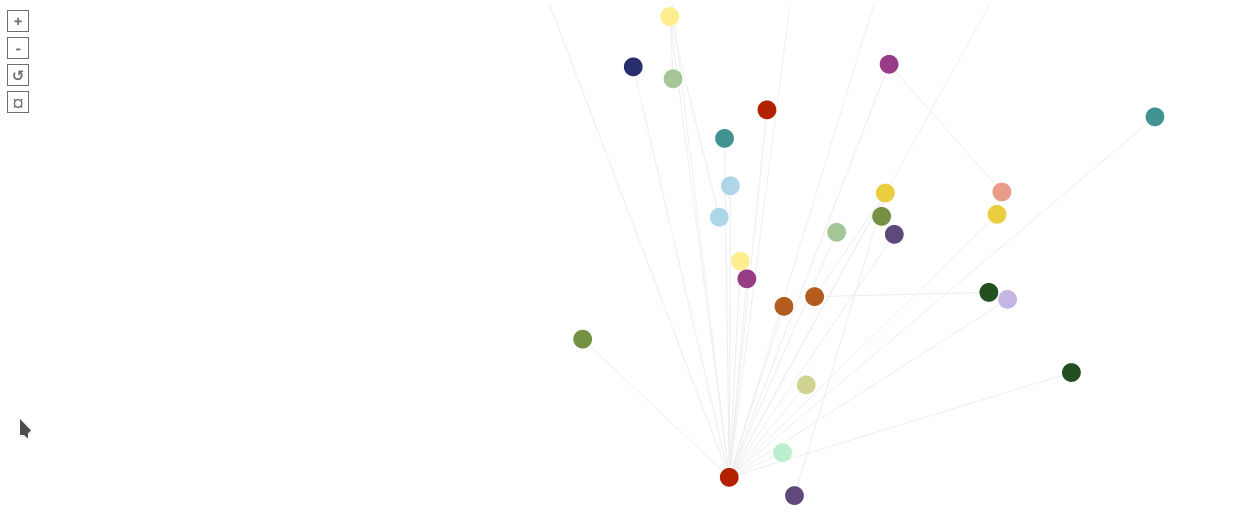
Representation of the projects or parts thereof as a force directed diagram
Treemap views
Various tree views have long been part of the reporting plugin especially for the project overview. The following views can be selected here:
- Treemap - Spent time
- Treemap - Estimated Time
- Treemap - Estimated hours (open)
- Treemap - Budget exceedance
- Treemap - Issue amount
- Treemap - Open issues
- Treemap - Closed issues
- Treemap - Wiki pages
- Treemap - Password amount (if plugin is installed)
- Treemap - Contacts amount (if plugin is installed)
- Treemap - DB entry amount (if plugin is installed)
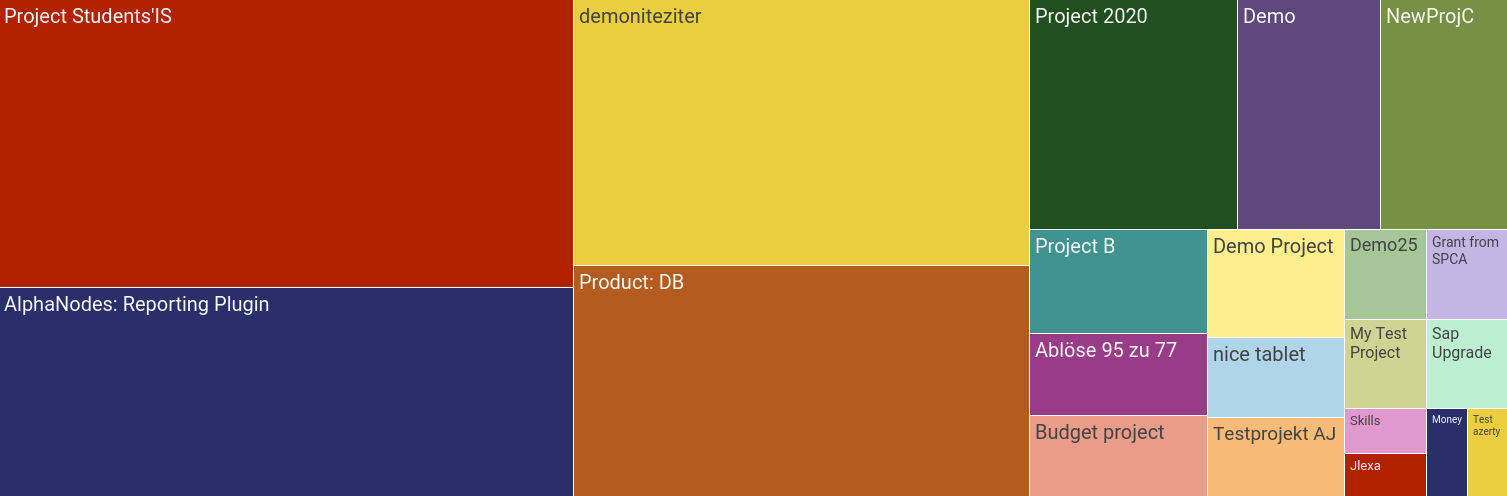
Figure shows the treemap representation for projects using the Redmine Reporting Plugin.
Definition Treemap: Treemapping is a method of displaying hierarchical data using nested figures, usually rectangles.
Advantages Redmine Reporting extended project list
The Redmine Reporting Plugin extends your Redmine installation with additional reporting and planning functionality. Here some advantages you get when using the extended project list coming with the Redmine Reporting.
| Project list | Redmine basic | Reporting plugin |
| Different display options | 2 | 18+ |
| Number of filter & columns for better overview | 5 | 29+ |
| Atom, CSV export format | ||
| PDF, XLSX export format | - | |
| Font Awesome Icon support | - | |
| Live-Search / Field search | - |
If you want to test the different project overviews, you can take a look at the functions of the Reporting Plugin in our Redmine Online Demo and read all the information on the product page. We are happy to help with specific questions.