
With version 4.7.0 of the Reporting plugin you can answer questions about your everyday project work more precisely by building your own charts on the dashboard. Until now every chart on the Redmine dashboard was predefined: issues by tracker, issues by priority, new issues per day. From now on you decide what is shown, matching what you want to know.
When the chart you need is missing
Individual questions such as “How many open issues of the team are there per customer?” are now easy to map, with our configurable dashboard blocks:
- Chart: Issues for the start page and the project overview
- Chart: Spent time for the start page, the project overview and the HRM dashboard
- Chart: Logs for the start page and the project overview
- Chart: Projects for the start page
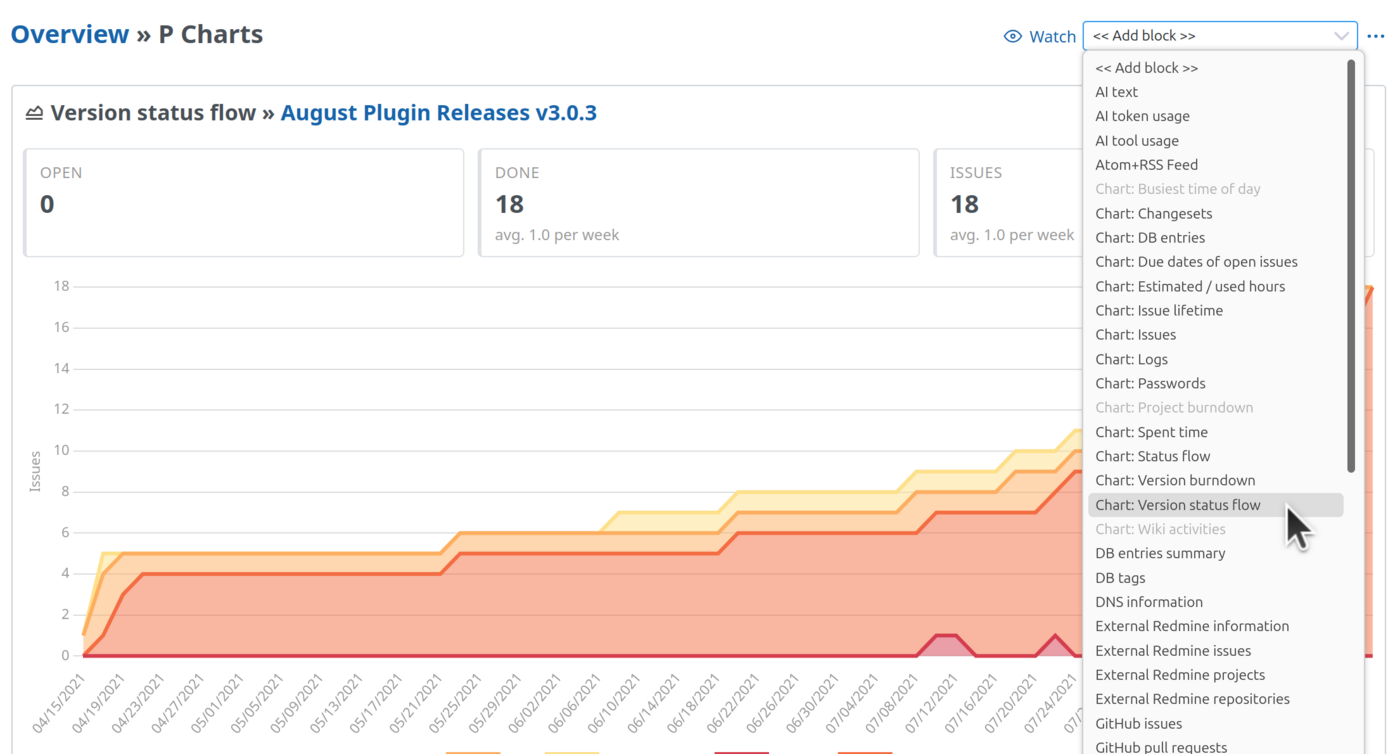
You can add each block up to eight times to a dashboard, each with its own evaluation.
Four decisions to the finished chart
When you set up a block, you make these decisions:
- Data: Which entries are evaluated? A saved query defines this, for example “My open issues”. Without a query the block counts everything you are allowed to see.
- Evaluation: Which field are the entries grouped by, and are they counted or summed up? You can choose from the fields of the list, including custom fields.
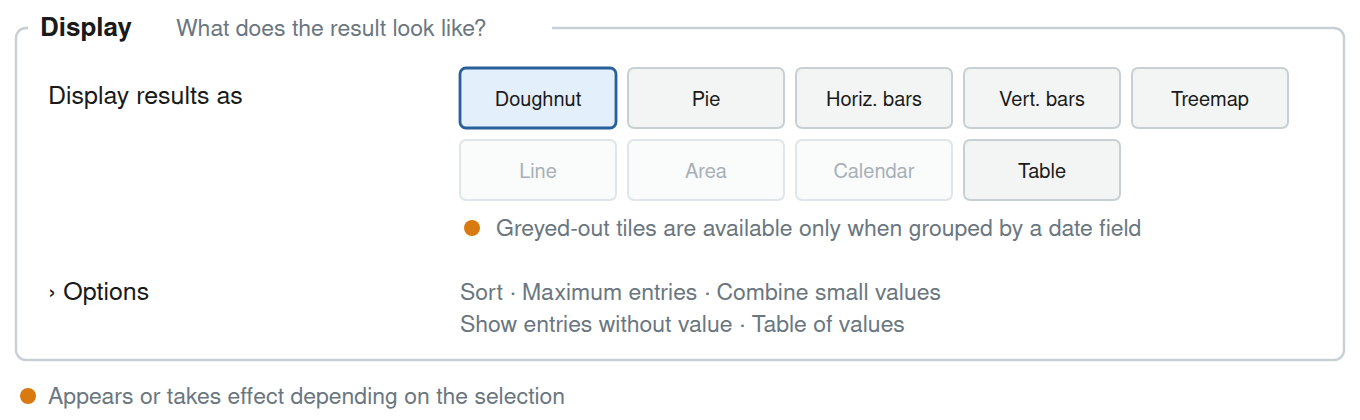
- Display: doughnut, pie, bars, treemap, line, area, calendar or table.
- Labelling: optionally a title and a description of your own.

Only the field to group by is required. Everything else already has a sensible default. Above the settings you see what the block will show with your selection, for example “Open issues: Quantity per Tracker, as Doughnut”. So the result is clear before you save.
The type of field determines the shape. A list field such as status or tracker results in one entry per value. A date field results in a timeline per week, month, quarter or year. A number field such as estimated time is divided into ranges. Display options that do not fit are greyed out.
Four examples from everyday project work
How are my open issues distributed? Chart: Issues with the query “My open issues”, grouped by tracker, as a doughnut. The total is shown in the middle.
How many hours did the team log per activity this month, compared with last month? Chart: Spent time with the period “this month”, grouped by activity, compared with the previous period, as bars. For each activity, last month and this month stand next to each other. The period moves along: in December the block shows the December entries.
How many issues came in per month, and how urgent were they? Chart: Issues, grouped by created per month, split by priority, as an area chart. If the share of high priorities grows, you see it at a glance.
Do we meet our due dates? Chart: Issues, grouped by the new field Due date deviation (days), the gap between the due date and the closing date. The block divides the closed issues into five ranges from “more than a week early” to “more than a week late”. Earlier ranges are blue, on time is grey, later ranges are red.
When charts say more than numbers
Every segment, every bar and every number in the table of values links to the filtered list behind it. If you notice a big slice “without target version” in the doughnut, you click on it and see exactly these issues.
Below the chart the block also shows which query it evaluates, with a link to the list. If the query has a description, it appears below. So everyone knows where the numbers come from.
Who has access to the dashboard block
The block only counts what the viewer is allowed to see. The project manager sees different numbers in the same block than a colleague with access to fewer projects. A shared dashboard therefore shows nobody data they would not also see in the issue list.
More new charts
Version 4.7.0 of the Reporting plugin brings further blocks that help you evaluate your project:
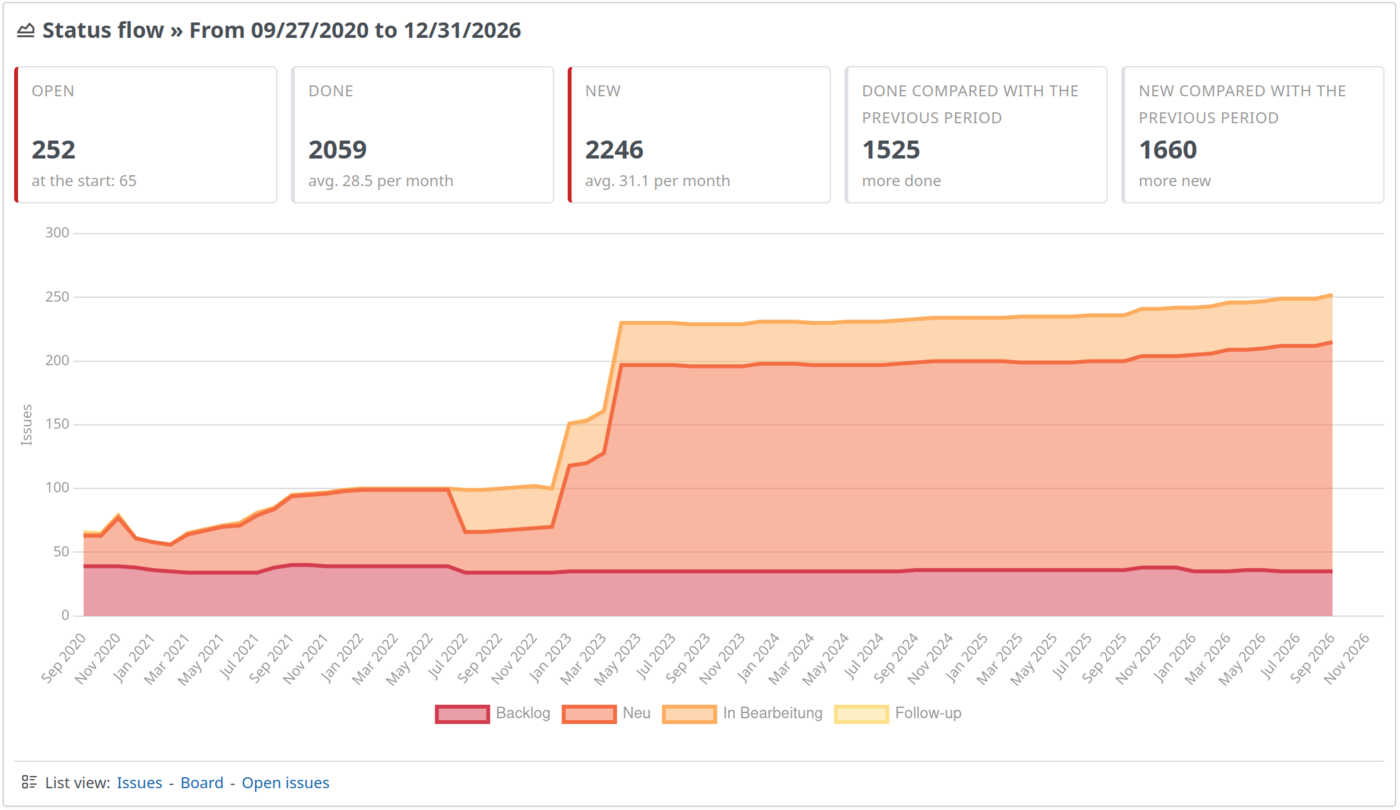
- Chart: Status flow: how the issues of a query are distributed across the statuses over a period, with key figures on open, closed and new issues.
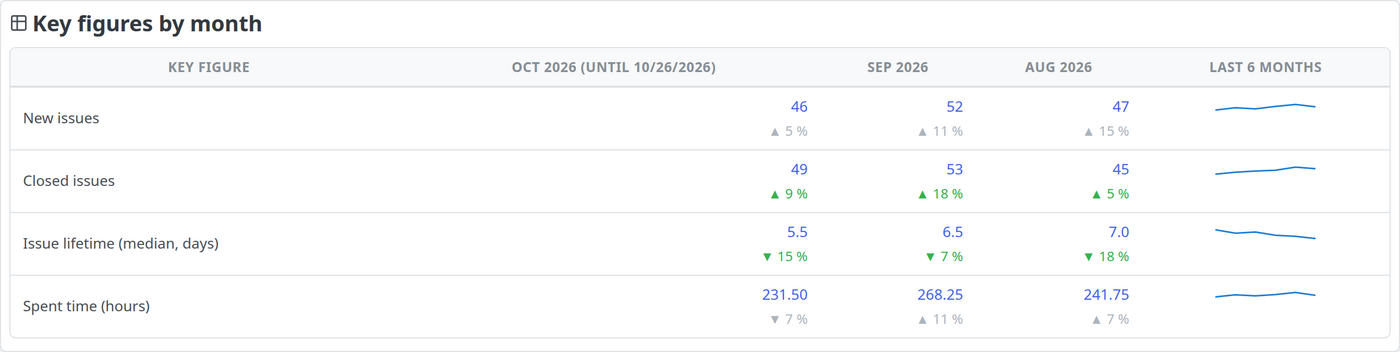
- Key figures by month: new and closed issues, issue lifetime and spent time of the last three months, with the change compared with the previous month.
- Chart: Issue lifetime: how many days issues take from “created” to “closed”.
- Chart: Version status flow: the issues of a version day by day per status, optionally compared with a second version.
The update works without extra effort
When you update to version 4.7.0, the plugin converts existing dashboards automatically. The fixed charts are replaced in the same place by chart blocks with the matching field. You do not have to set anything up again, but you can adjust the converted blocks afterwards.
The other AlphaNodes plugins bring the same block type for their data: HRM for users and attendances, ServiceDesk for contacts and invoices, DB for DB entries, Passwords for passwords and DevOps for changesets. Once you know one block, you know them all.
Conclusion
The new dashboard blocks are especially useful for teams that ask themselves the same questions regularly. If you create a block for exactly that question, you see the current state at a glance. The answer is on the dashboard, without anyone exporting a list.
The configurable chart blocks are part of the Reporting plugin. The plugin is available on its own or in the bundle. It is also available to our Redmine Hosting customers.
Useful links
- Reporting in Redmine: which chart type fits which purpose and where to find it in the Reporting plugin.
- Redmine dashboard guide: which blocks belong on which dashboard.