
In our guideline on how to use the dashboard function of the additionals Plugin with the Reporting Plugin widgets for marketing teams you will learn a scenario to help you kickstart your workflow.
A dashboard is usefull if you want to customize your Redmine Home page or Project overview page. It is the diving board into the data relevant for you and your team. Because, what is measurable, will be done. Learn how.
It’s all in the data
Data is the foundation of your dashboards. In order to be able to display this information you first need to have relevant data sources. In your case working with Redmine you need information in form like tasks, versions, spent times, files and stuff like that. You can also create queries based on this data and filter them down in a way that makes sense to you.
What you need, to create a marketing dashboard with charts and queries: You will need the latest Redmine Version 4.1.x, the additionals v3.0x, the redmine reporting v3.0x, a configured role, with dashboard access. The latest plugin version 3.0x are not yet released, but will be available soon. Check our product update page regularly
Dashboards are a great starting point
The content in your first dashbaord can be anything. Like team tasks, client tasks, creative requests, project overview list, graphical charts and much more - everything coming with the AlphaNodes Redmine Plugins is possible! Start with just adding one personal dashboard to get started, add the rest later!
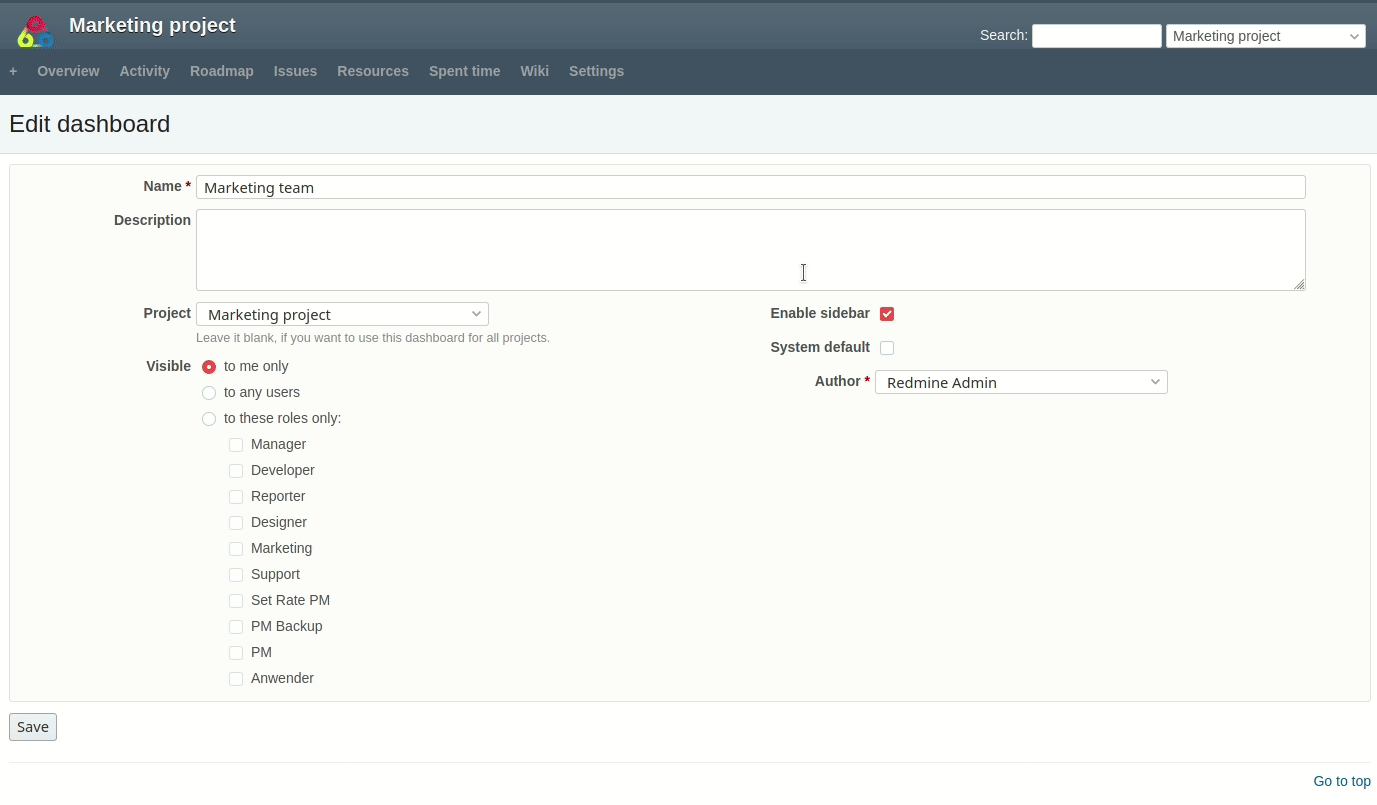
Create your first dashboard
Dashboards allow you to add so called blocks (which are for example provided by the Reporting Plugin), to see crucial elements at a glance.
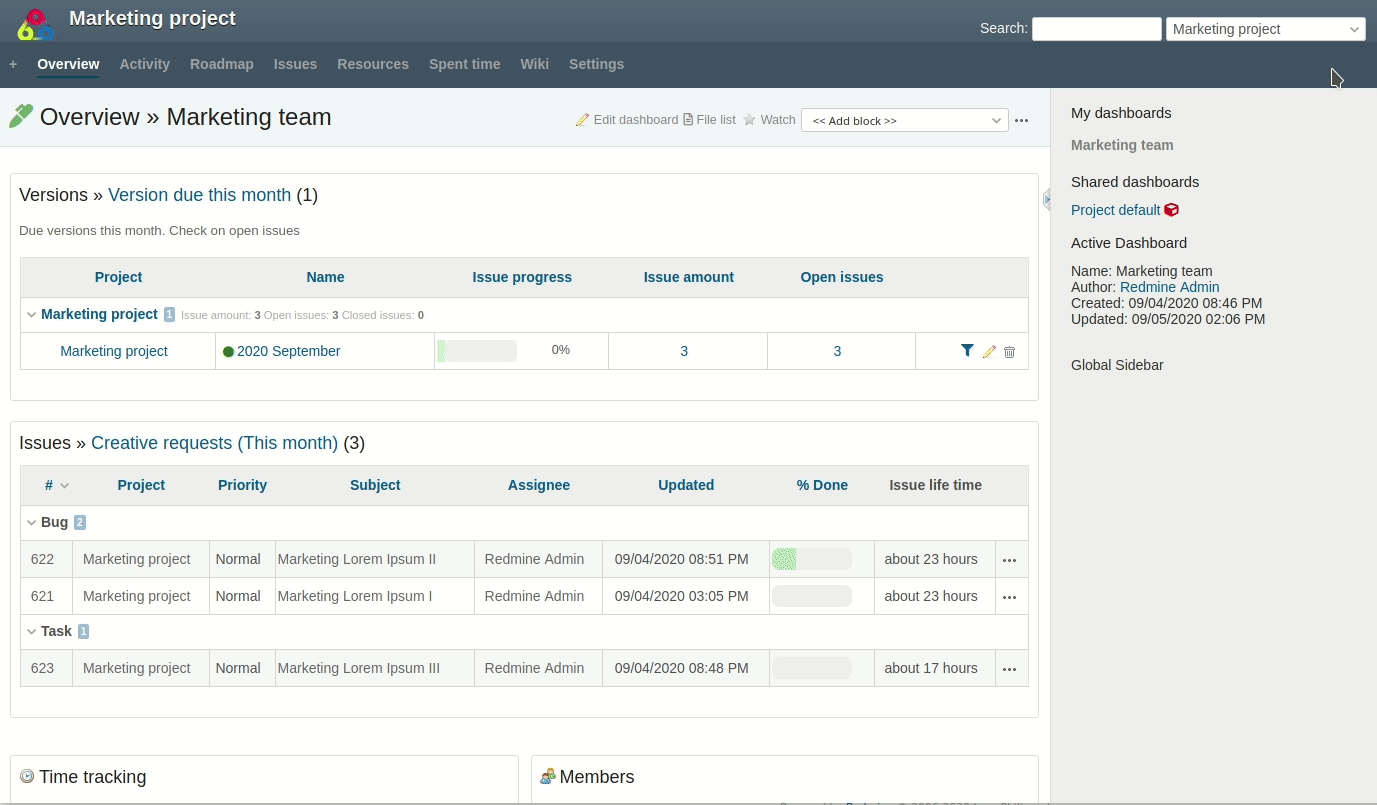
 The image shows you how easily dashboards in a project are customizable.
Let’s say, you are managing a marketing team.
- You can use Issue query blocks for open issues, to stay on top of your team work.
- Roadmap information of upcoming versions, due this month.
- Chart blocks, to visualize things like Assigned Issues or current budget information
- And a chart block Issue status division to better understand the stage of your tasks. Need more info on the details of the chart? No problem, simply click on the chart area to get to the detailed view.
Now, it’s your turn. Let’s add a dashboard to stay on top of your team assignments.
- Start by opening the Actions menu / clicking New Dashboard
- Fill out the required information and save them.
- Add an existing issue query via Query: Issues.
- If the required query does not yet exist, create one (e.g. My Issues). Go to the issue list and filter down the list in a way that makes sense to you before saving it.
- Add other information, relevant to you like Wiki activities or a chart on Overdue issues.
 It’s easy to add private dashboards. And also as easy to share them with others.
As you can see, Dashboards are completely customizable and allow you to configure things to make sense for each use case. Even key stakeholders can keep an eye on the progress any time they want. Just by using a dashboard of their own or a shared one.
Tipp: Dashboards are good if you no longer want to send relevant data by e-mail. Instead, use a customized dashboard and share it with specific users (e.g. a specific role).
How many dashboards do you need?
The number of dashboards you need depends on what data are relevant to you and your team. What data you want to share or report to other. Each marketing team has a different approach and creates different types of dashboards: for themselves, for their manager, for a client (stakeholder).
Here are some examples to help you figure out how many dashboards you might need:
- Periodic dashboards are most popular. You can display data relevant to you for a time period (daily, weekly, monthly, querterly, anualla etc.)
- Dashboards for specific roles are second popular. Here you put all data, relevant for the specific role within a medium time frame (last 7, 14 or 30 days etc.)
- Campaign dashboards are also interesting. In connection with Redmine a campaign might be an ongoing or upcoming Version of the Roadmap and all tasks around it.
Basically, you can create one dashboard for all projects or for each project individually. You can also create a dashboard for a specific user role involved in the project, or a personal one for yourself. It’s really up to you!
Advantages for marketing teams
- Display of key performance indicators.
- Give your team the ability to dive right into important work.
- Integrate all the data relevant for your marketing team and present them in an easy to read display.
Test Dashboard Function for Redmine
The dashboard function is part of the Additionals Plugin v3.x. If you install it on your Redmine system v4.1x or higher, you can design the Redmine Home-Page as well as the Project Overview pages with so called Blocks.
Learn more on our upcoming dashboard function by visiting our online demo. There you can already test what’s coming soon with plugin version 3.0x. All our commercial Redmine plugins (DB, Passwords, Reporting, HRM) are supporting the dashboard function of the Additionals Plugin with the upcoming version.
Coming soon: Not usable with Plugin version 2.0.6 of DB, Passwords, Reporting, HRM. You need version 3.0x or higher.