
For Redmine users, finding useful functions to efficiently manage tasks is an ongoing quest. When multiple users are working with Redmine on a daily basis, the number of accumulated issues can become overwhelming.
In addition to gaining a better overview of tasks, users often desire to understand the connections between existing issues. The Reporting Plugin provides an enhanced issue list that fulfills this need. In this article, we will introduce three functions that improve the Redmine issue list, resulting in an enhanced user experience.
1. Live search for issue list
A typical problem in many projects is, that users are often looking for a specific issue. But they can neither remember the ID nor the project. Usually, either the possibility of filters and options is used for the issue search. Or you use the cross-project Field search in the header of Redmine and restrict it to the issues, only.
Both options require several clicks until the desired issue is tracked down. You can imagine how time-consuming this would be.
Our solution: live search for issue lists
With the help of the convenient Search-as-you-type Live Search in the header of the issue list (cross-project, project related), you can find a specific issue more quickly in the future.
When users enter a search term into the search box, the live search function will dynamically display matching results as they type.
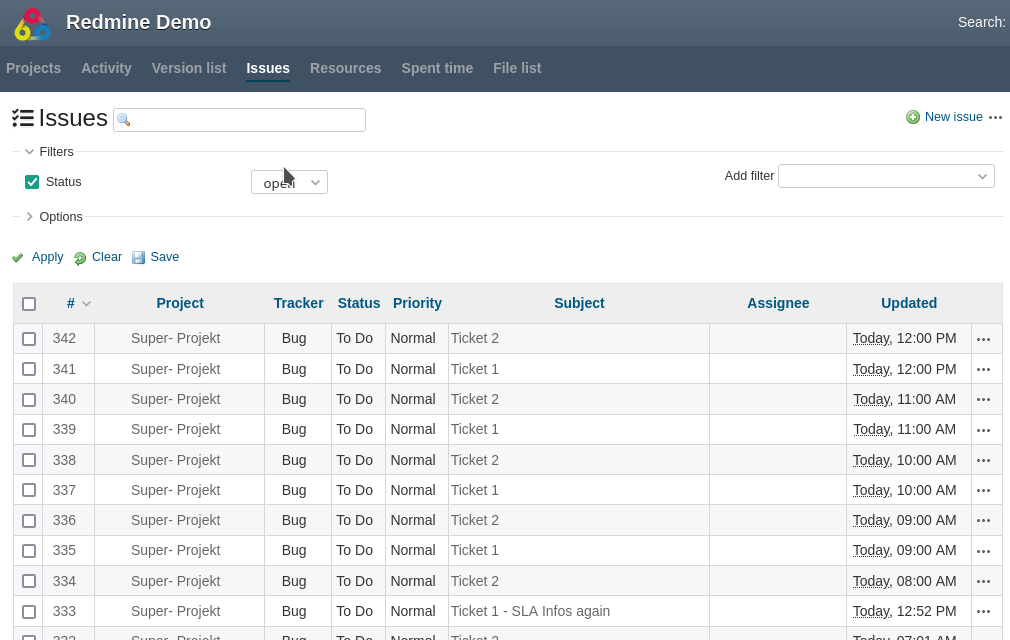
Even available parameters for the field search are usable. Those are displayed in a tool tip as soon as you hover over the search field with the mouse.
2. Show issue dependencies (Flowchart)
Another common problem is that in the course of a project’s life, a large number of issues can quickly grow together and become interrelated.
In the issue list it is often difficult to see which issue contains (how many) sub-tasks. Or which tasks are linked to each other in some way. And can therefore pose a certain risk in the completion sequence.
Our solution: Issue dependency flowchart
With the help of a graphical output regarding the issue dependencies, the user is already helped a lot here. Finally, dependencies among each other are better visible. Critical issue paths can be recognised more effectively. You can also see whether dependencies to issues from other projects exist.
The graph must be selected from the issue list option List style and displays only issue dependencies (no regular issues without dependency).
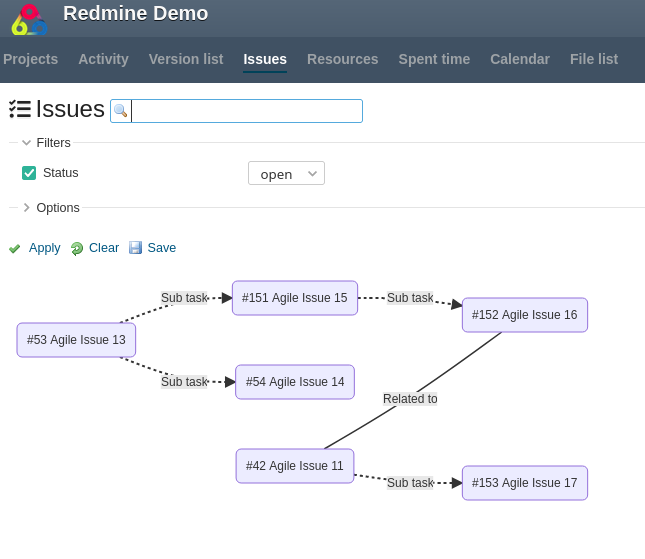
The issue dependency flowchart for Redmine uncovers critical issues in all your projects.
3. Treemap diagrams on issue metrics
Treemap charts are perfect for displaying hierarchical data in a simple and space-saving way. This type of graphical evaluation is perfect for issue metrics like:
- Estimated time
- Round trips
- Round trips (total)
- Spent time
- Total estimated time
- Total spent time
- Watcher
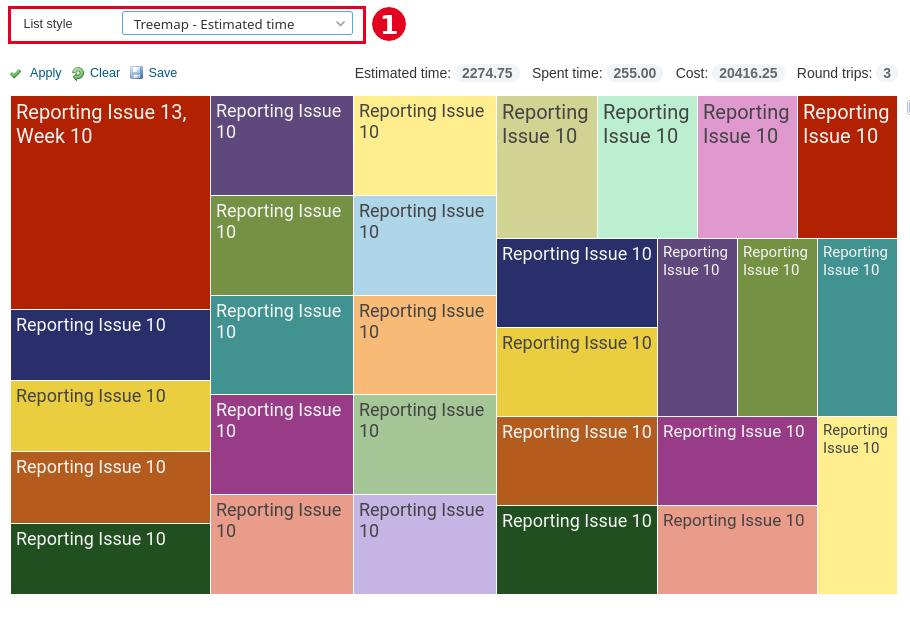
1. The issue list offers treemap diagrams for various metrics like Estimated time, Round trips, Watchers etc.
The graph must be selected from the issue list option List style. The results are linked to the respective entry by clicking on the area in the graph.
Our Redmine Managed Application Hosting customers benefit from new plguin features early on and can already use them in their current Redmine instance hosted by us before go-live.
Test the issue list functionality for Redmine
Check out the described possibilities in our online demo: Our public demo instance is always available and great for getting a first impression of the functionality that is part of the current plugin release.