
In many teams people work on too many things at once. This usually becomes a problem at the end of the month, because little has been completed. Lean approaches this differently: fewer tasks in parallel, but finished sooner.
Part of the lean principles can be covered with tools you probably already have. If a current version of the Reporting Plugin runs in your Redmine, you do not need another tool for it.
Definition of lean: James Womack and Daniel Jones summarised lean in Lean Thinking in 1996 in five principles: define value from the customer’s point of view, analyse the value stream, create an even flow, pull work instead of assigning it, and improve the process continuously. The aim is to leave out everything that does not create value for the customer.
Who works this way and when it pays off
Lean originally comes from the Toyota production system of the 1950s. The approach later moved into administration, hospitals, construction and software development. You are probably familiar with Kanban. Many teams work according to lean principles and call it Kanban.
It pays off for recurring work with a constant inflow: support and service, maintenance and operations, administrative processes, issue work in IT departments. As a rule everywhere that work is hard to plan in advance.
For one-off projects with a fixed deadline and scope it fits less well, for example a migration or a relocation. There you plan better with dates and dependencies, in Redmine with the Gantt chart.
Making the workflow visible
The first principle is an agreement within the team: what does the customer pay for? There is no tool for that.
For the second one Redmine helps. The value stream is the sequence of steps an order runs through. Map these steps as statuses, including the waiting statuses: Waiting for customer, Waiting for approval, Waiting for delivery. Without them, the waiting periods appear nowhere.
On the Taskboard the statuses become columns. A column Waiting for customer shows how many issues are currently not in your hands. Adding a grouping creates swimlanes, meaning one horizontal row per group, for example per person or per target version.
Limiting started work
A WIP limit defines how many issues should be in a status column at the same time. WIP stands for work in progress, meaning work that has been started.
On the Taskboard you enter the limit per column, either when editing the saved query or directly in the column header. If it is exceeded, the board marks the column. You can still move an issue there, the limit blocks nothing.
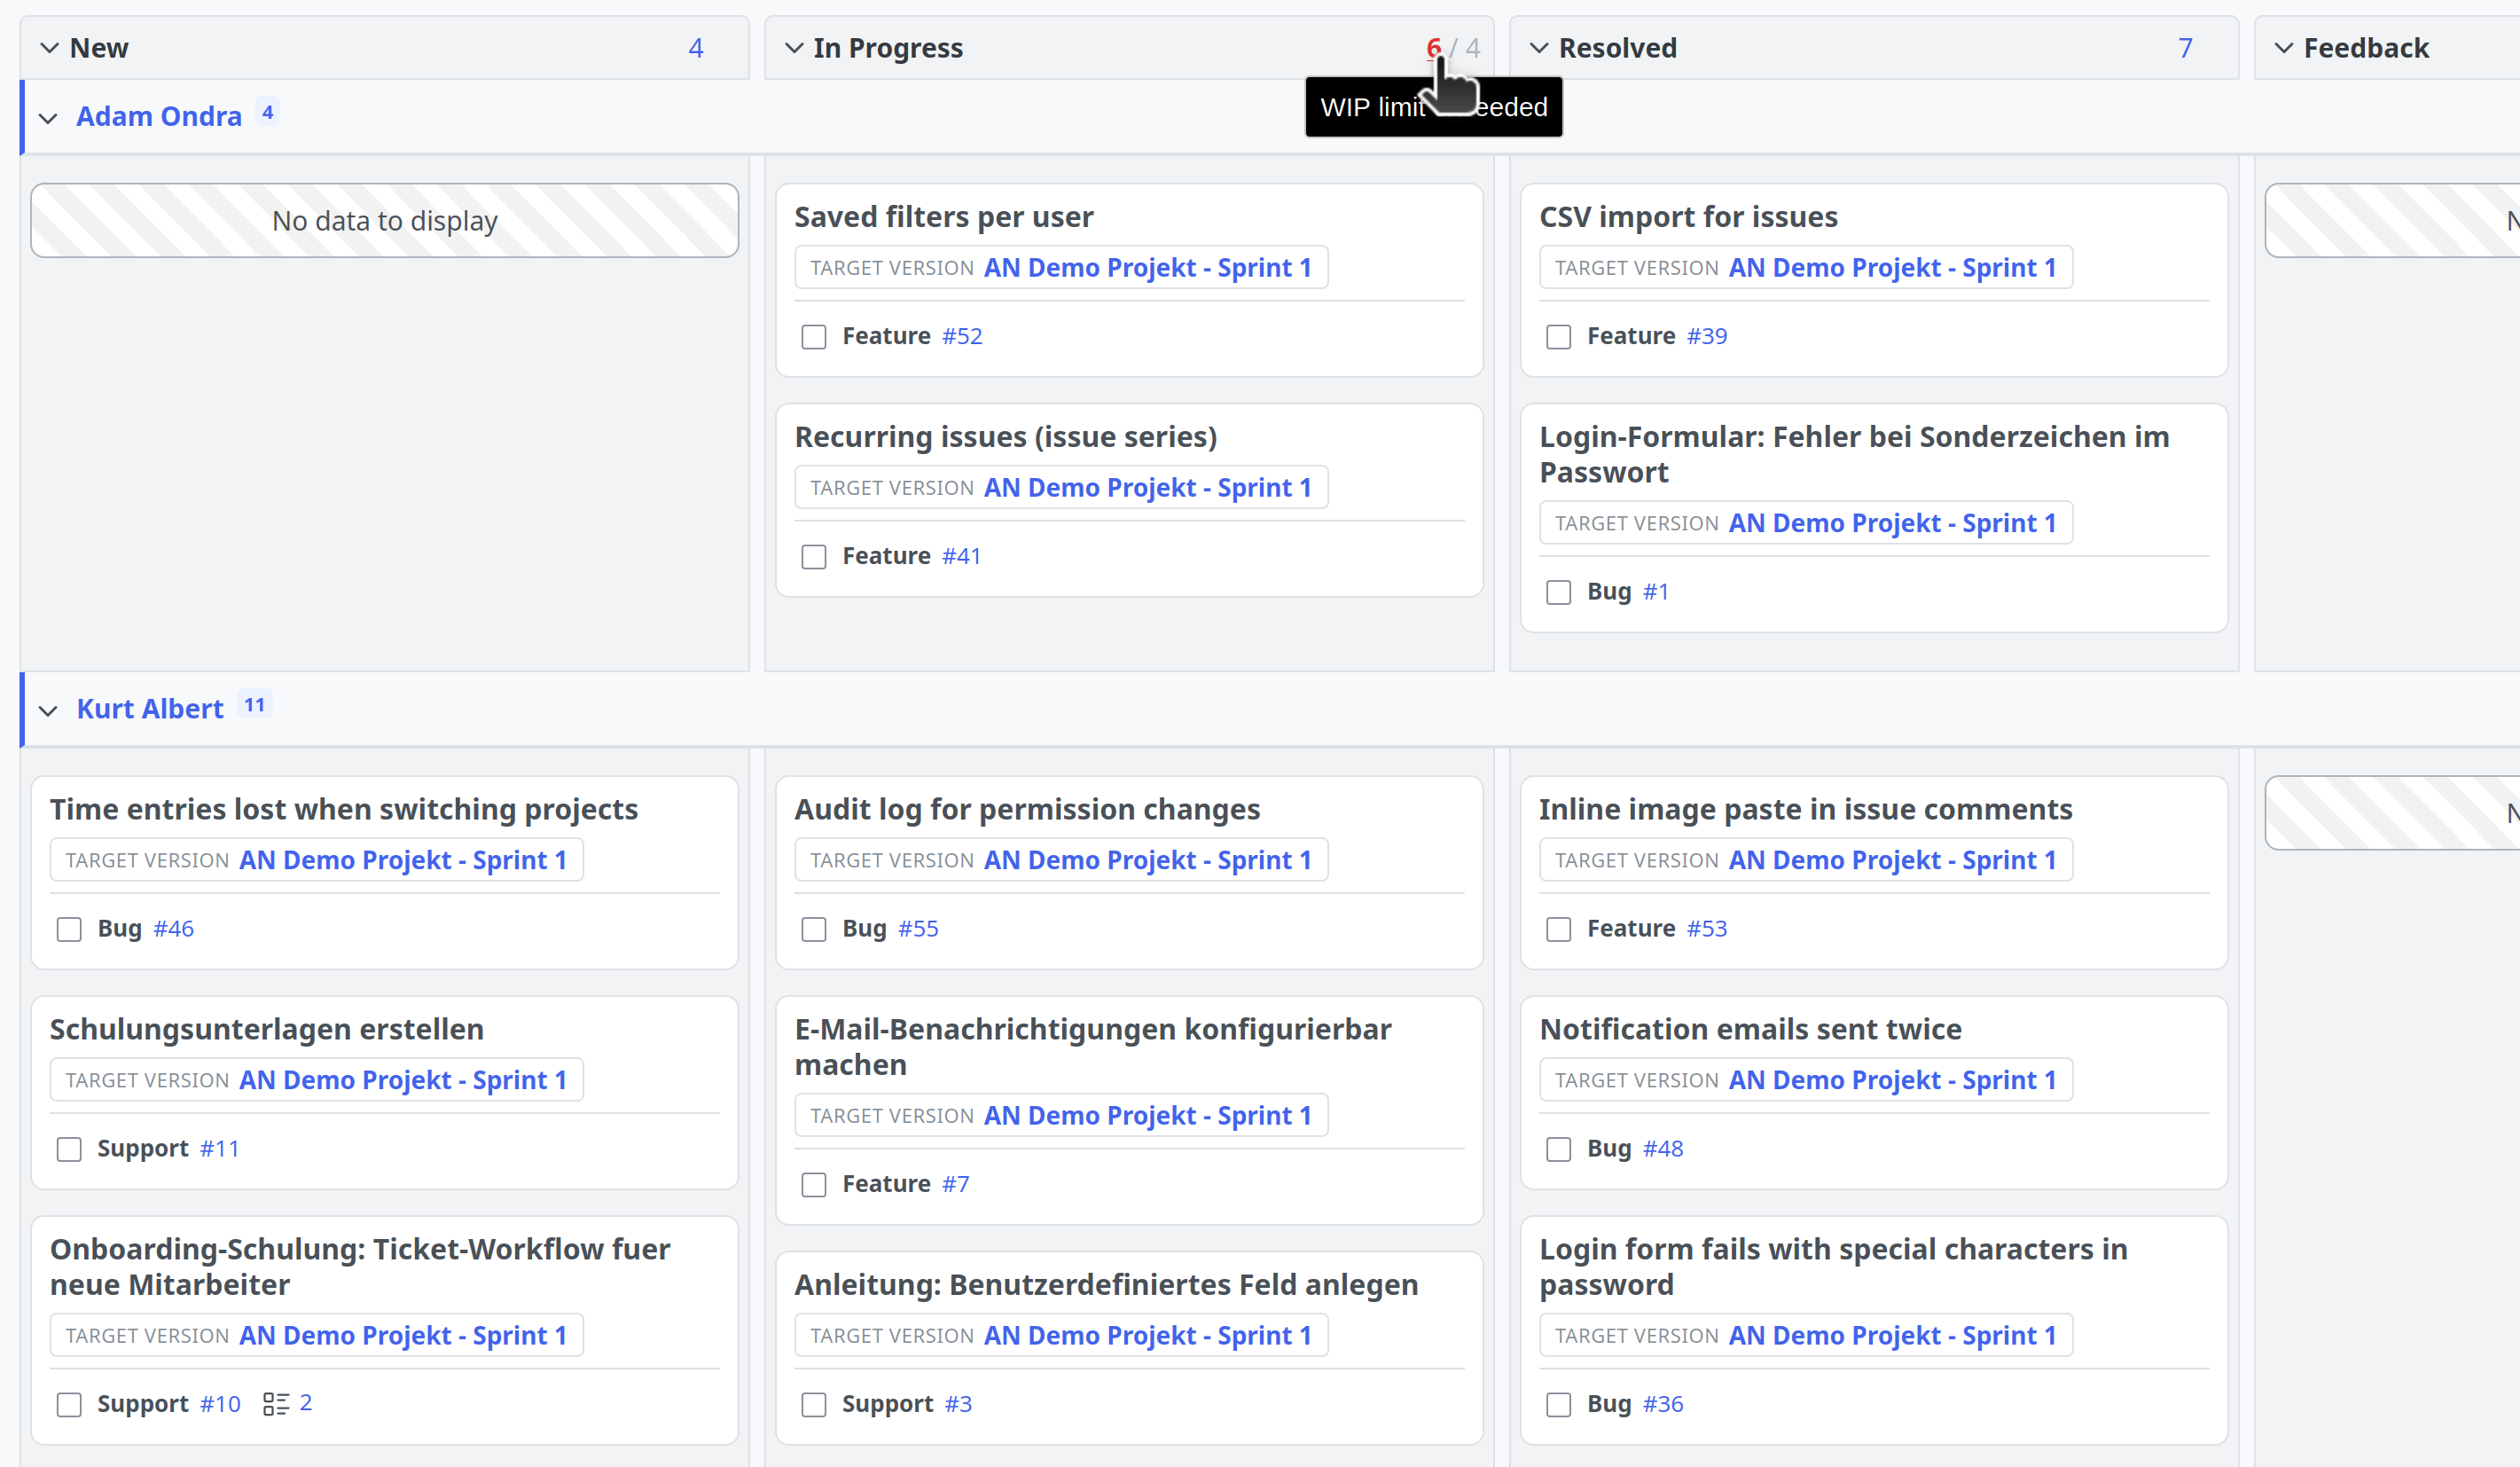
Full columns show the bottleneck in the workflow. How to find the right number is described in the post about WIP limits.
Pulling work instead of assigning it
Pull means: whoever has capacity takes the next task. The alternative is assigning work in advance. Then everyone has a long list and nobody knows what comes first.
On the board it works like this: one column (e.g. Backlog) holds the released issues. Whoever is done takes the top issue and assigns it to themselves by dragging their avatar onto the card. The issue does not have to be opened for that.
The order within the column follows the sort order of your query, so for example priority or due date.
Measuring rework
Rework hardly shows up in reports. An issue goes from review back into progress, is reviewed again and goes back again. Time gets logged, but the order does not move forward.
The Reporting Plugin counts these loops as round trips. A user with administration rights defines in the plugin configuration which status change is counted, which status counts as the preceding one and which one resets the counter. On top of that comes a threshold above which Redmine shows a warning.
The counter is then available as a column in the issue list and can be shown as a total for a query. It exists twice: Round trips counts from the last reset, Round trips (total) across the entire life of the issue.
Both are filters as well. So you can narrow the issue list down to all issues with three or more rounds and save the result as a query.
This shows you which issues run through the same loop several times and for which tracker this happens more often. The cause usually lies in an unclear task description or in an approval without defined criteria.
How long issues have been sitting around
The second key figure from the Reporting Plugin is the issue life time. For open issues this is the time since it was created, for closed ones the time from creation until completion.
It is available as a column in the issue list, as a field on the board card and as a filter with fixed steps from 30 minutes up to 12 months. With the operator is not and the step less than 2 weeks you get all issues that are older than two weeks.
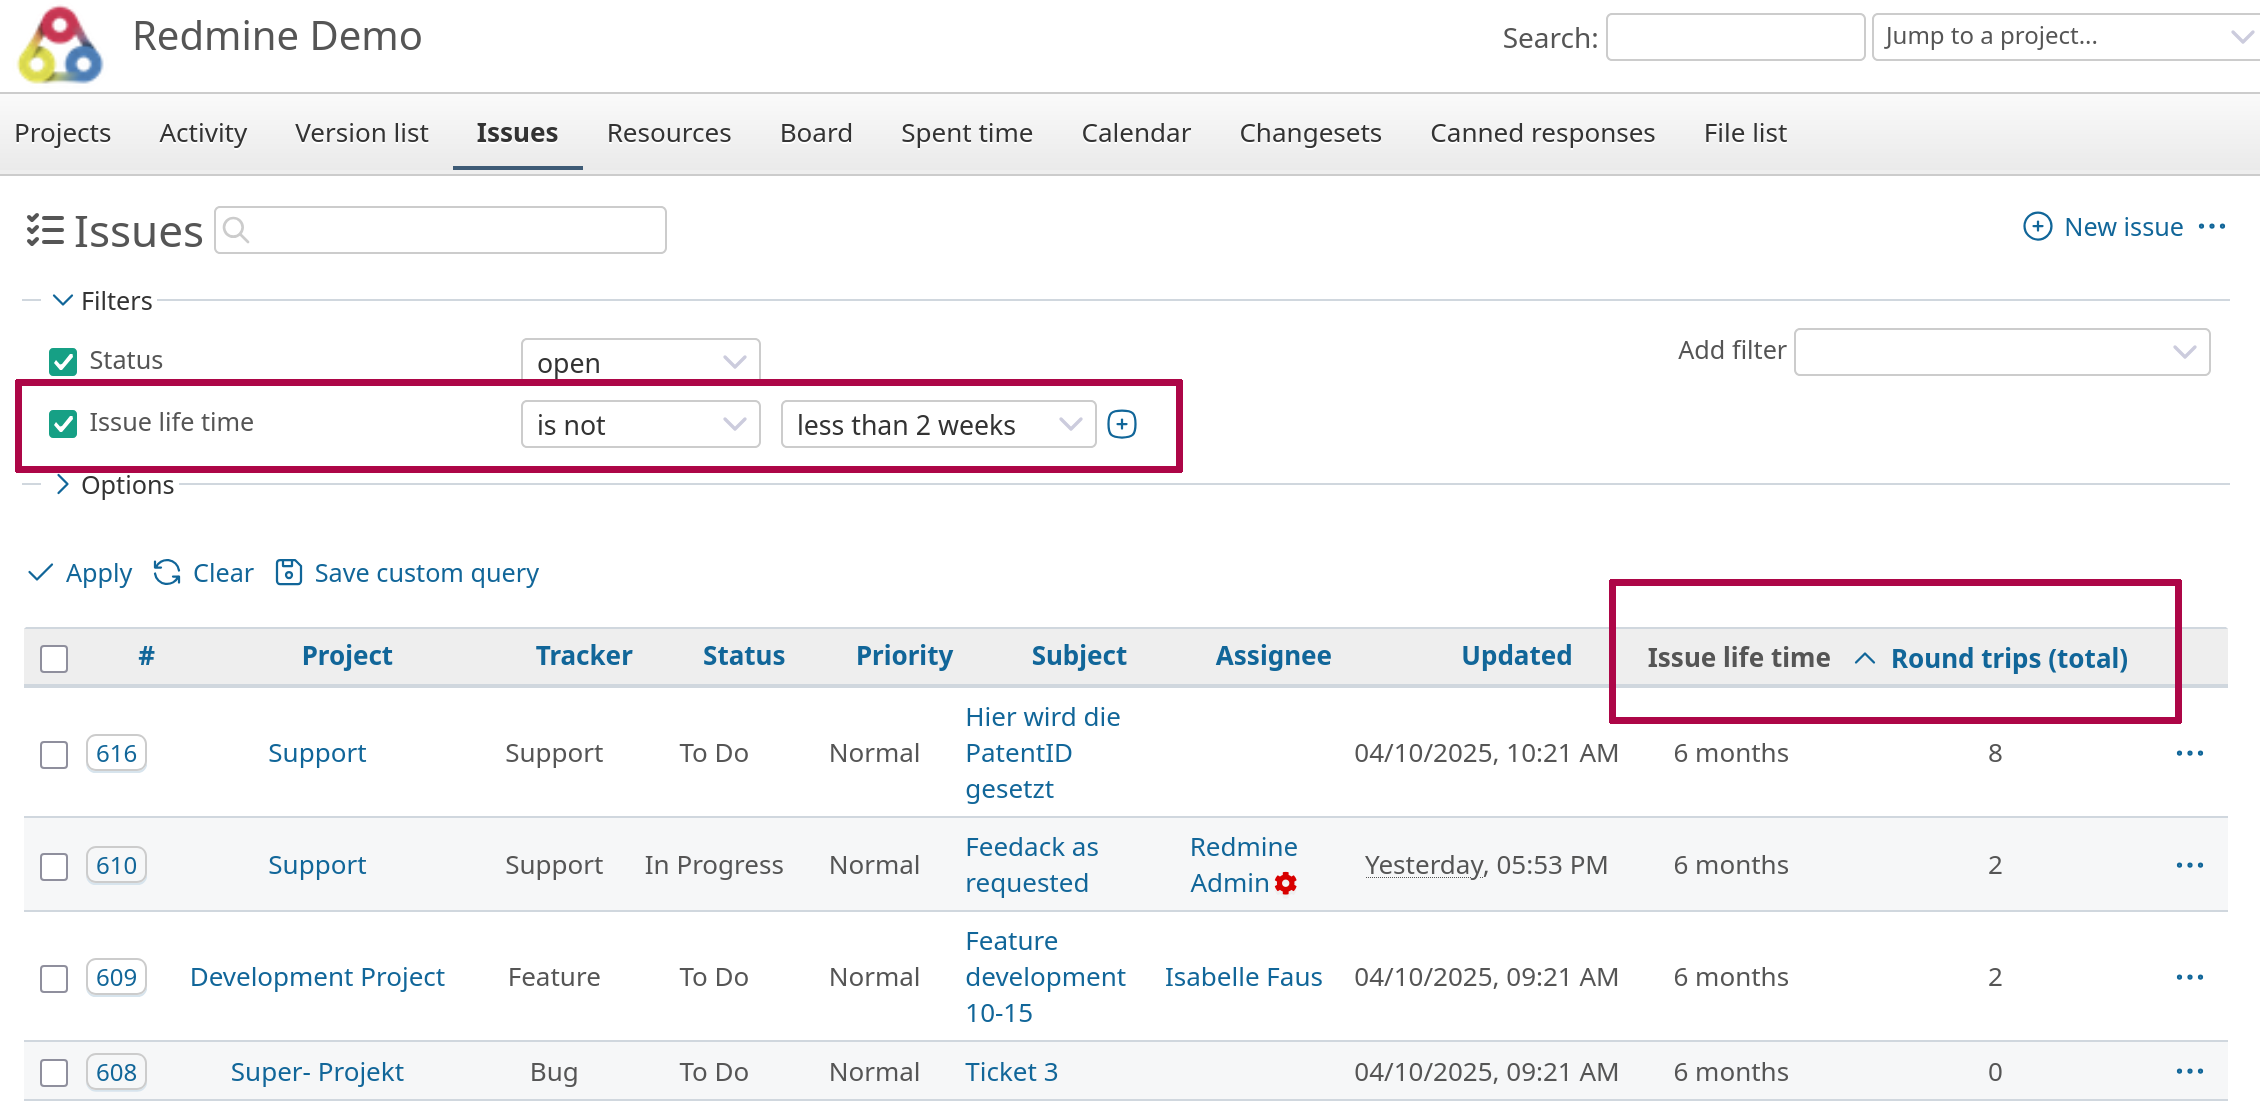
You save this query and activate a counter box for it. The number of issues left lying around is then shown on the home page or in the project overview, without anyone having to look for it.
Reviewing regularly
Improvement needs numbers from everyday work. Counter boxes on the home page show every user what is open and what is waiting for them.
For status meetings someone otherwise puts the numbers together by hand. A dashboard takes them from the live data: open issues per status, overdue issues, logged time, round trips.
In support the SLA module comes on top. It measures response and solution time and takes business hours and public holidays into account.
Where Redmine reaches its limits
Two reports that are common in lean are not available ready-made:
- Average values for the lead time. The life time is available per issue, an evaluation across all issues is not. How the average lead time develops over the months is something you have to determine via an export.
- Analysis of the flow over time. There is no cumulative flow diagram, meaning the development of the work in each status over weeks. Nor is there a ready-made chart for the throughput, meaning the number of issues completed per week. With counter boxes and suitable queries you get close to an approximation.
Anyone who needs these numbers permanently works with an export into an analysis tool or with a specialised Kanban tool.
Conclusion
For the operational part of lean the Reporting Plugin is a useful aid: make the workflow visible, limit started work, spot bottlenecks and rework. You do not need a second system next to Redmine for that.
When it comes to analysing the work flow over time it stops earlier than specialised Kanban tools do. Anyone who needs those numbers permanently will not get around an export or an additional tool.