Every project collects issues, time entries, wiki pages and documents. If you want to know where things stand, you click through several lists. A dashboard puts it on one page: on the Redmine home page and on the overview page of every project.
What is a dashboard in Redmine?
A dashboard is made of blocks. Each block shows one part: an issue query, a chart, the latest activity, key figures or your own text. You pick the blocks, arrange them by drag & drop and configure them, for example which query a block shows.
Most blocks link to the content behind them. That makes the dashboard the entry point to the project: get the overview first, then click on where you need details.
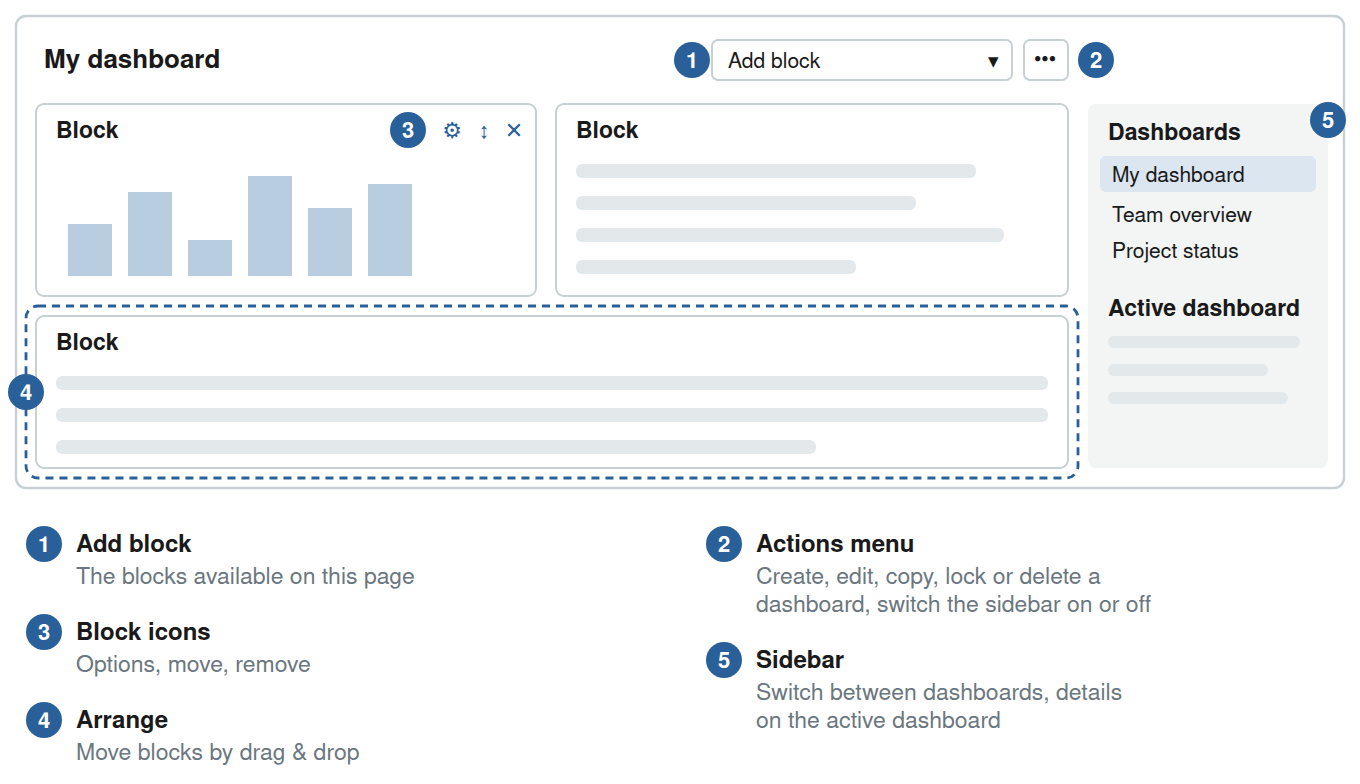 The areas of a dashboard page: add block, actions menu, block icons, arrange and sidebar.
When one dashboard is supposed to show everything
A dashboard that shows everything ends up showing nothing. One that answers a single question works better. Dashboards with a focus on these have proven useful:
- one person, for example your own open issues and due dates
- one role, for example project management, an agile team, marketing or support
- one task, for example a release or issue triage
You can create several dashboards and switch between them. Redmine remembers which one you opened last and shows it again next time.
What can I do with dashboards?
Depending on your permissions:
- create, edit, copy and delete your own dashboards
- switch between several dashboards, in the sidebar or the actions menu
- share dashboards: with all users, only with certain roles or only for yourself
- set a dashboard as System default. It appears for everyone who has not chosen another one.
- change the author of a dashboard, for example when someone else takes over its maintenance
- lock a dashboard, so a shared dashboard stays as it is
The role decides which functions someone may use. The permissions are Save dashboards, Share dashboards and Set system dashboards.
Which plugins add dashboard blocks?
The basic set includes blocks such as issue queries, activity, news, documents, members, Atom feeds and a text block.
Our plugins come with dashboard support. This means: each plugin adds its own blocks with evaluations and information from its area.
- Reporting: charts on issues, projects and spent time, burndown charts, key figures and counter boxes
- HRM: attendance, birthdays, anniversaries and user queries, plus its own dashboards in the HRM area
- ServiceDesk: helpdesk key figures, first response time and customer satisfaction
- DevOps: information from GitLab, GitHub, Jenkins, Zabbix, Hetzner Cloud and other Redmine instances
- DB: DB entries as query, summary and tags
- Passwords: password queries and new passwords
- WikiGuide: wiki pages and open read confirmations
- Timesheet: weekly key figures and team overview of time tracking
- Issue Checklists: open checklists
- Templates: queries on templates
- AI (hosting only): AI texts and evaluations of AI usage
Which blocks you see depends on the installed plugins, the active modules and your permissions. Each block only shows data you are allowed to see.
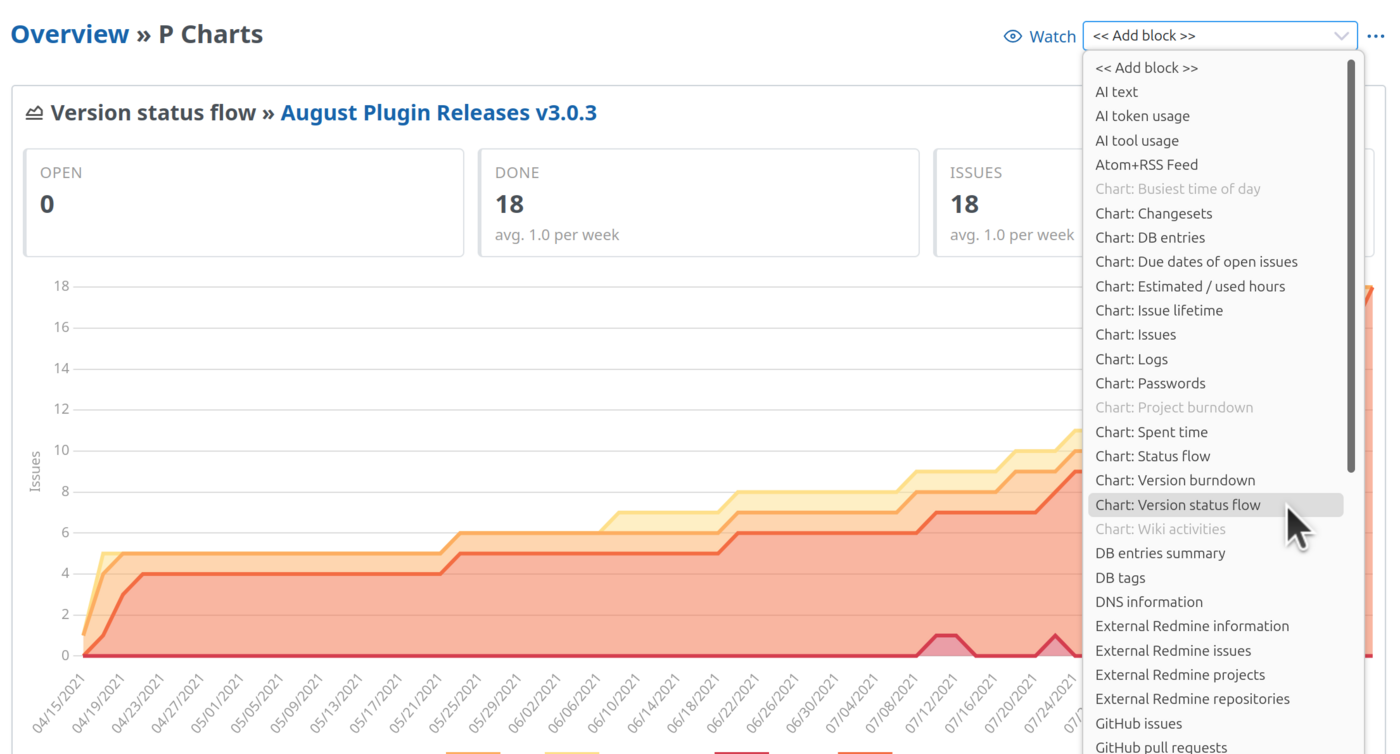 The selection Add block lists all blocks available on this page (as of Reporting Plugin 4.7.0).
How do I customize a dashboard?
If you have the permissions, you see the selection Add block and the actions menu (the three dots) above the dashboard. The easiest start is the dashboard that comes with Redmine, which you rebuild step by step.
- Add a block: pick the block in the selection, it appears on the dashboard.
- Configure a block: the gear icon on the block opens its options, such as query, number of entries or period. What you can set depends on the block.
- Move: grab the block at the arrow icon and drag it to its new place.
- Remove: the X on the block.
- New dashboard, copy, lock, sidebar: in the actions menu.
Try dashboards
In our online demo you create and rebuild dashboards without installing anything. The demo is reset regularly, so you cannot break anything.