
From version 4.7.0 of the Reporting plugin, the start page of Redmine can show charts about all your projects. The block Chart: Projects counts projects or sums up their values, grouped by any project field you like.
The dashboard block Chart: Projects is available from version 4.7.0 of the Reporting plugin.
When you have more projects than you can open one by one
Agencies, IT departments and service providers often work on various projects at the same time. The project list of the Reporting plugin already shows key values like budget, spent time and open issues of every project. But sometimes a list does not tell you at a glance which months are tight or which customer causes the most effort.
Chart: Projects puts these answers on the start page of your Redmine application. Like the other chart blocks of version 4.7.0, you set it up in four steps: data, evaluation, display and labelling. How this works in general is described in our post on dashboard charts.
For projects this means:
- Data: a saved project query, for example “Active customer projects”. The option Active projects only leaves out closed and archived projects.
- Grouped by: status, budget type, public, the planned project dates, the creation date, the budget in ranges, or a custom field of the project such as “Customer” or “Project type”.
- Measure: the number of projects, or the sum of a column of the project list, for example spent time, cost, budget, estimated time or the issue counts.
When several projects end in the same month
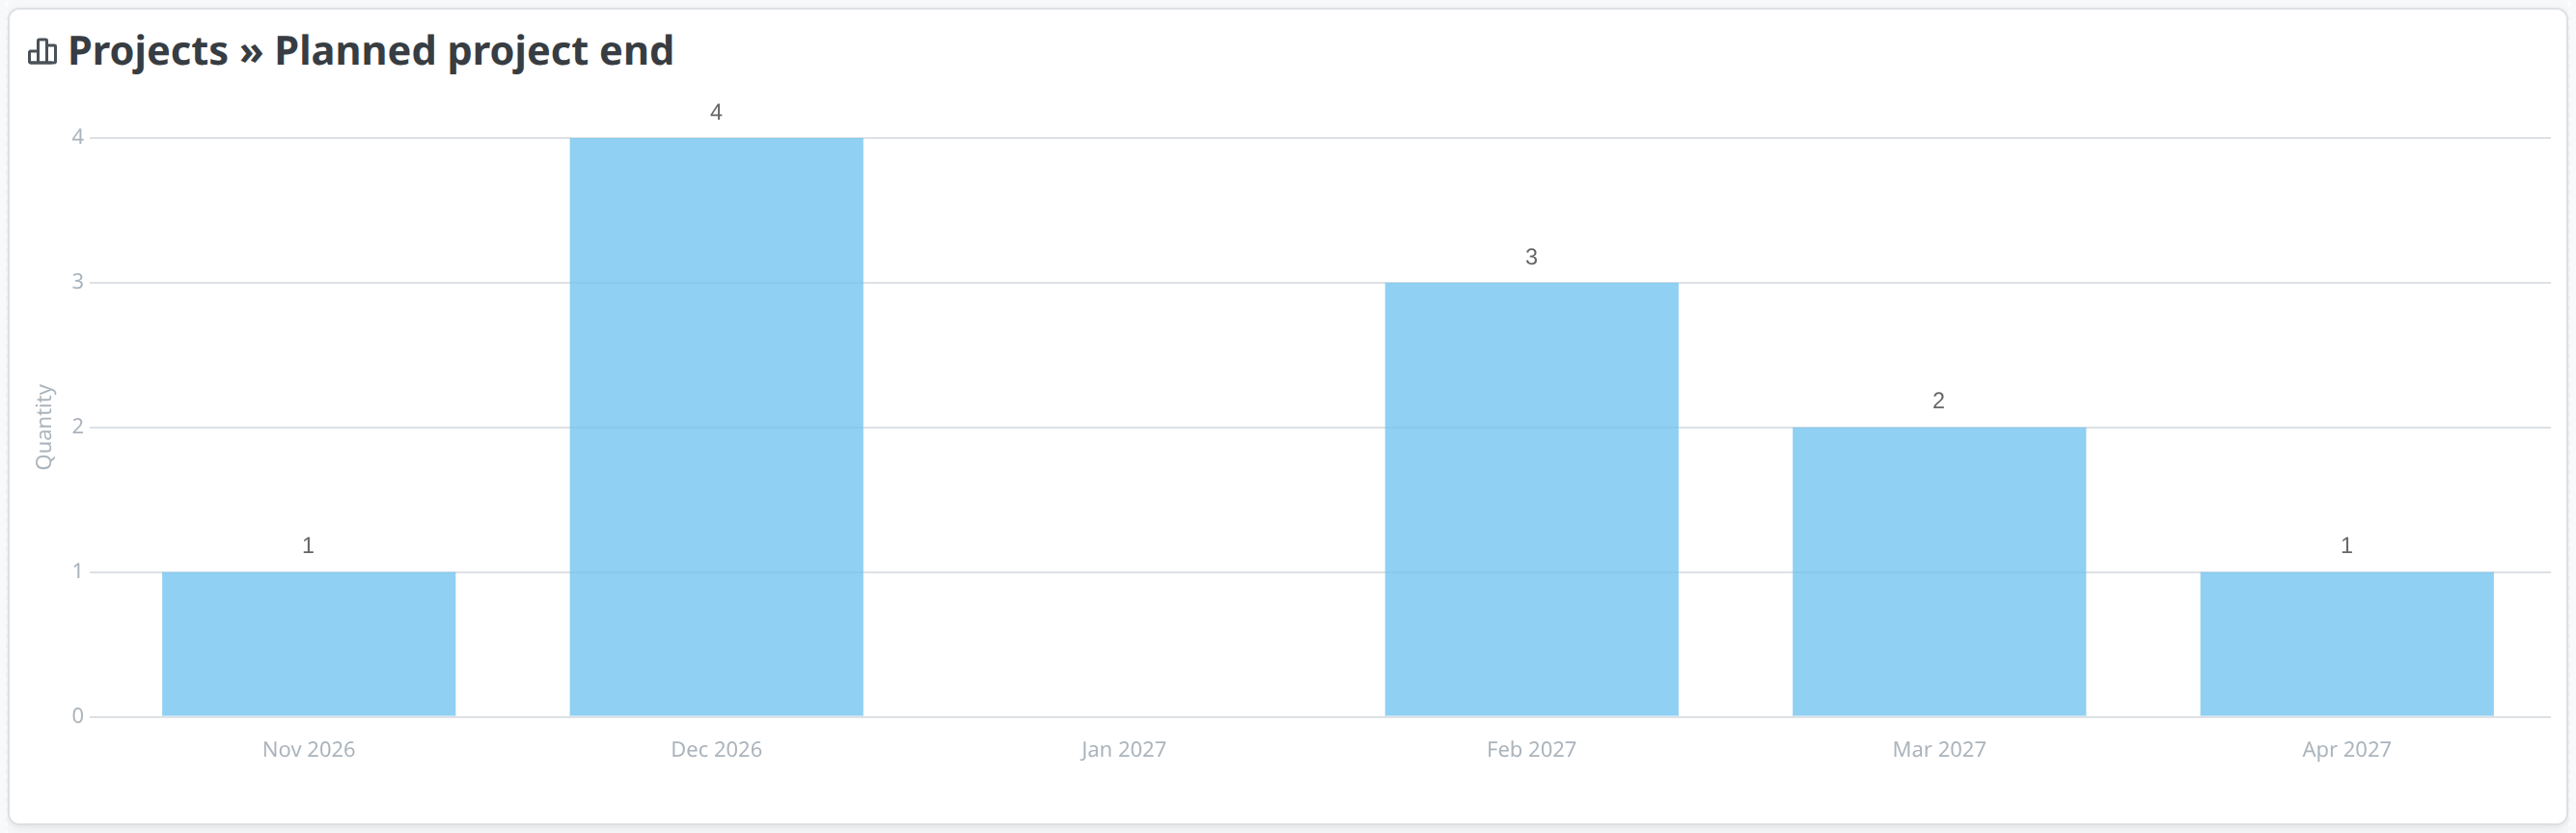
You plan the team for the next months. Several projects end at the same time, and nobody noticed.
The setting:
- Project query with the filter Planned project end in the next six months
- Active projects only
- Grouped by Planned project end per month
- Display: Vertical bars
Each bar is one month. High bars show months in which many projects end. A click on a bar opens the list of these projects. In months without a bar, no project ends.
When a budget is exceeded and nobody notices
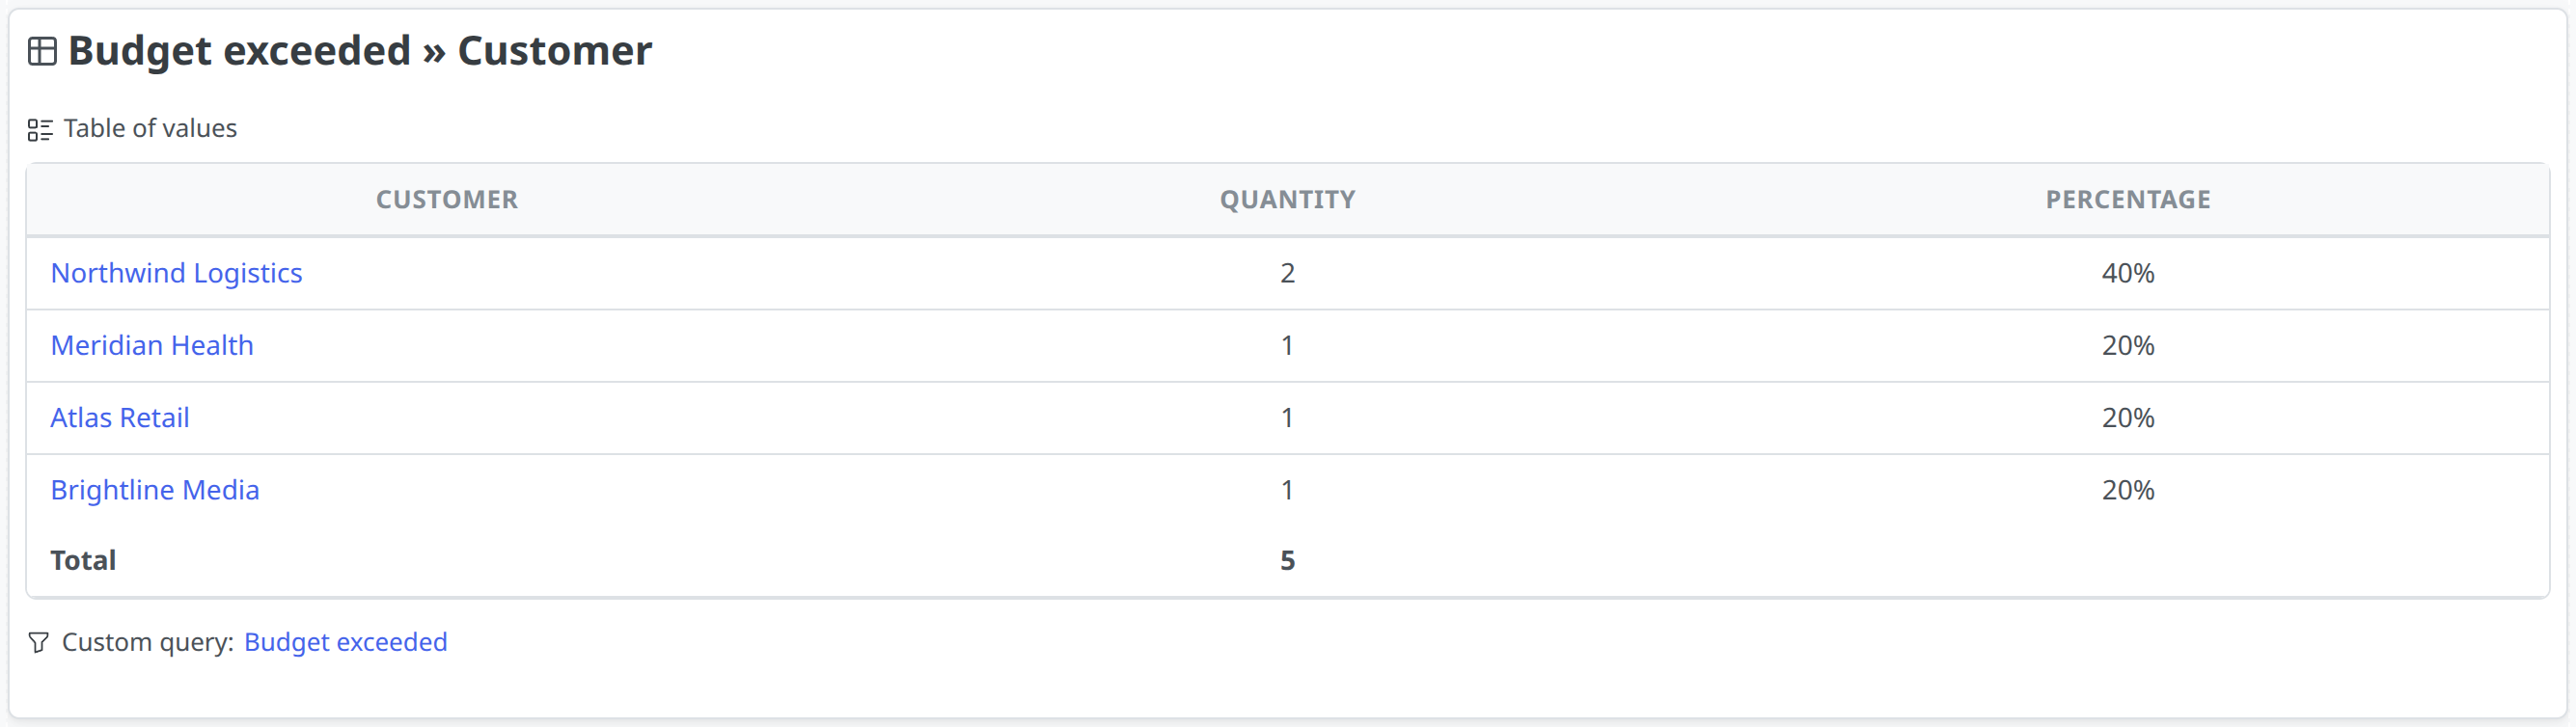
The project planning block of a single project shows when its budget is used up. But you only see it if you open the project.
The setting:
- Project query with the filter Budget exceeded is yes
- Grouped by a custom field such as “Customer”
- Display: Table
The start page now shows the customers whose projects are over budget, with the number of these projects. If no customer appears, no budget is exceeded.
When you want to know where the hours went
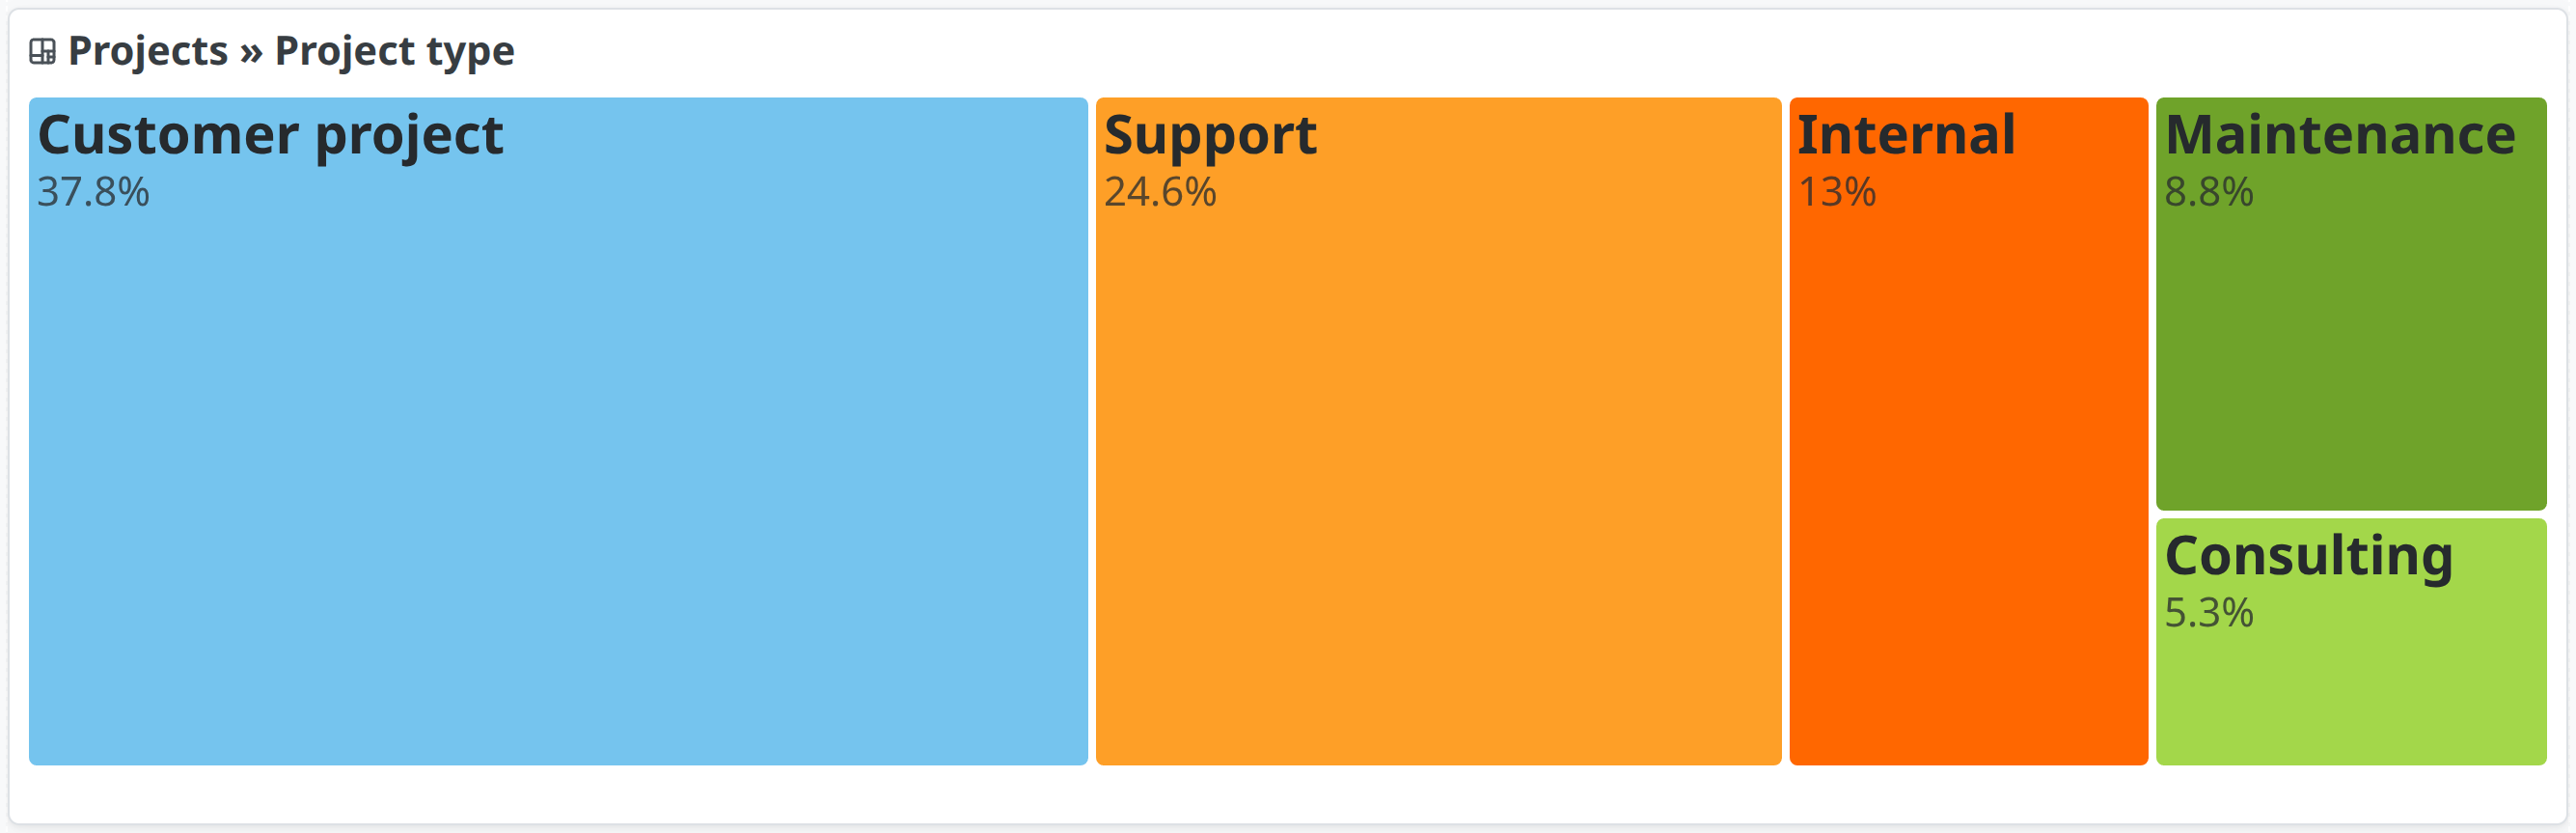
At the end of the month the question comes up: How much did we work on support, how much on new projects? Chart: Spent time cannot answer this if the type of work is stored in the project. Time entries cannot be grouped by fields of their project.
Chart: Projects can:
- Project query with the filter Estimated/Spent set to the current month
- Measure: Spent time
- Grouped by a custom field such as “Project type”
- Display: Treemap
The largest tiles show where most of the hours went. The filter Estimated/Spent limits spent time and cost to its period, so the chart always shows the current month.
When you need to know how much work is still open
New requests come in, and you have to decide whether the team can take them on. The open issues of all projects add up to a number nobody can estimate.
The new column Estimated remaining time helps here. It takes the estimated time of the open issues and deducts what has already been done according to % done. An open issue with 10 hours estimated time and 50 % done counts 5 hours.
The setting:
- Active projects only
- Measure: Estimated remaining time
- Grouped by a custom field such as “Customer” or “Department”
- Display: Horizontal bars
Each bar shows how many hours are still open for a customer. This only works if the team estimates its issues.
When you want to see how your project business develops
How many projects do we start per quarter? Are there more small projects than before?
For the number of new projects:
- Grouped by Created per quarter
- Display: Line
For the size of the projects:
- Project query with the filter Budget type is Total budget
- Grouped by Budget with the bounds
5000; 20000 - Display: Vertical bars
The block divides the projects into three ranges: below 5,000, from 5,000 to below 20,000, and from 20,000. The filter on the budget type matters: A monthly budget stores the amount per month and is not comparable with a total budget.
What the numbers count
If a number in the chart differs from what you expected, it is usually one of these reasons:
- Subprojects: Spent time, cost, estimated time and budget include the subprojects if the Redmine setting Display subprojects issues on main projects by default is enabled. Archived subprojects never count.
- Issue counts: Issue amount and Open issues only count the issues of the project itself, without subprojects. This way the number matches the issue list you get to with a click.
- Totals: The block counts every issue and every time entry exactly once, and only from the projects in its query. If only the parent project is in the query, the values of its subprojects are missing.
- Time tracking: Projects without the module Time tracking contribute neither spent time nor cost.
Who sees which numbers
The block only counts what the viewer is allowed to see. Cost and budget values require the permission View budget in the respective project. A team member without this permission sees the same block, but without budget values. A shared start page therefore shows nobody data they would not see in the project list either.
Conclusion
Chart: Projects is useful for everyone who is responsible for several projects at the same time: management, team leads, project office. Set up one block per recurring question, and the start page shows the current state every morning.
The block Chart: Projects is part of the Reporting plugin. The plugin is available on its own or in the bundle. It is also available to our Redmine Hosting customers.
Useful links
- Dashboard charts in Redmine: how the configurable chart blocks work and examples for issues and spent time.
- Project list of the Reporting plugin: columns, filters and totals across all projects.
- Redmine dashboard guide: which blocks belong on which dashboard.