Redmine shows projects as boards or as a list with name, description and a few standard columns. The Reporting plugin adds budget, cost, effort and issue counts to the list, with totals across all projects. On top of that come graphical views such as roadmap, treemap and flowchart. The project list becomes a report across all projects, without opening each one.
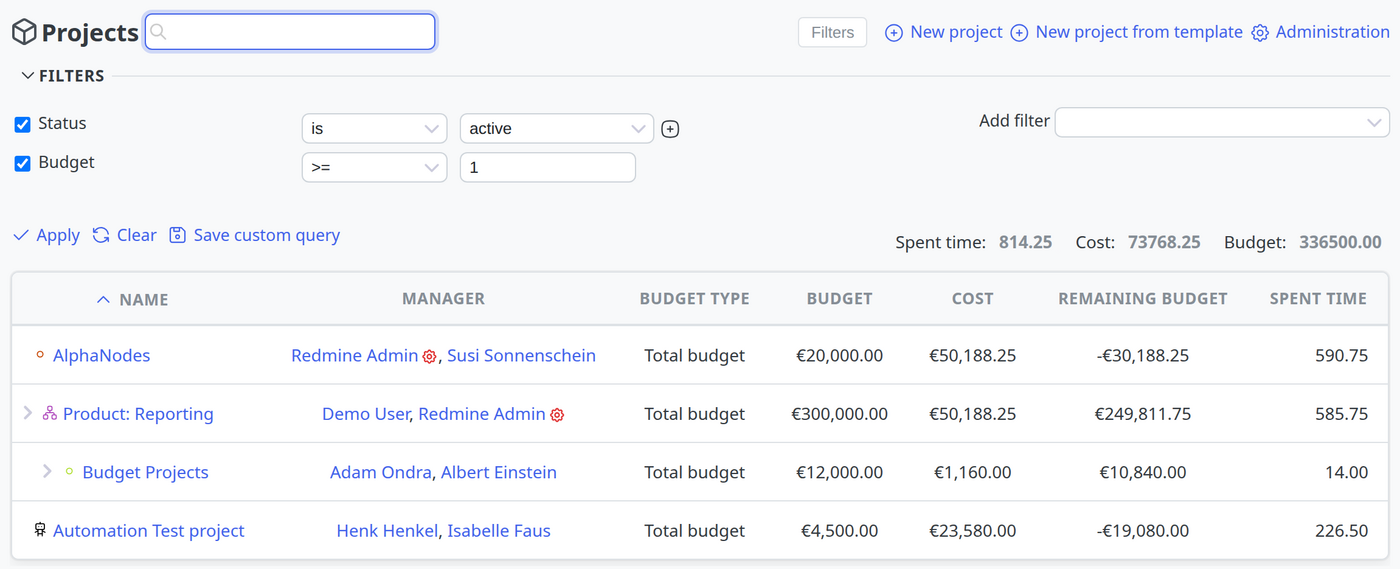
Budget and cost of all projects
Budget, cost, remaining budget and spent time appear as columns side by side, with totals across all projects. The plugin calculates the cost from the booked time and the hourly rates of your team.
A budget can be a total budget, monthly, quarterly, yearly, hour-based or day-based. Roles define who sees budgets and hourly rates.
Find the projects that need attention
Additional filters and columns show where things get stuck. Save the view as a query, and next time it is back with one click.
Effort exceeded
Projects where the spent time exceeds the estimate or the budget.
Due issues and open versions
How many issues are due and how many versions are still open, per project.
Project lead
Who holds the manager role in the project, as a column and as a filter.
Project tags
Group projects by customer, location or project type and evaluate them together.
With other AlphaNodes plugins you get matching columns, such as the number of DB entries, passwords, contacts or repositories. You export the list as CSV, XLSX or PDF.
The project list as a graphic
Instead of the table, choose a graphical view under “Display results as”. The filters still apply.
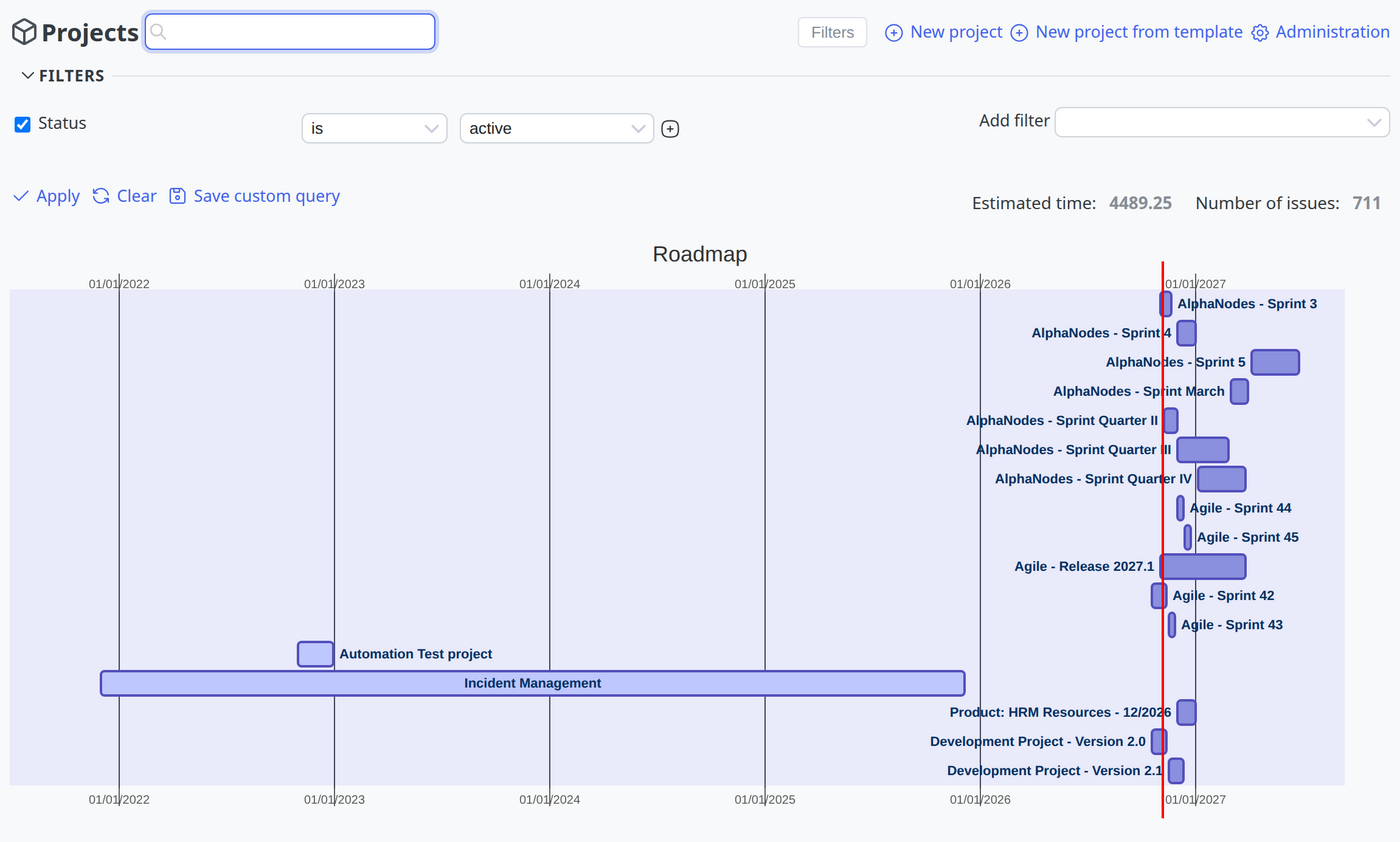
Roadmap
The roadmap shows projects and open versions on a timeline, with a line for today. You see when projects and sprints start and end, and where many projects overlap.
A project needs a planned start and a planned end, or an open version with both dates.
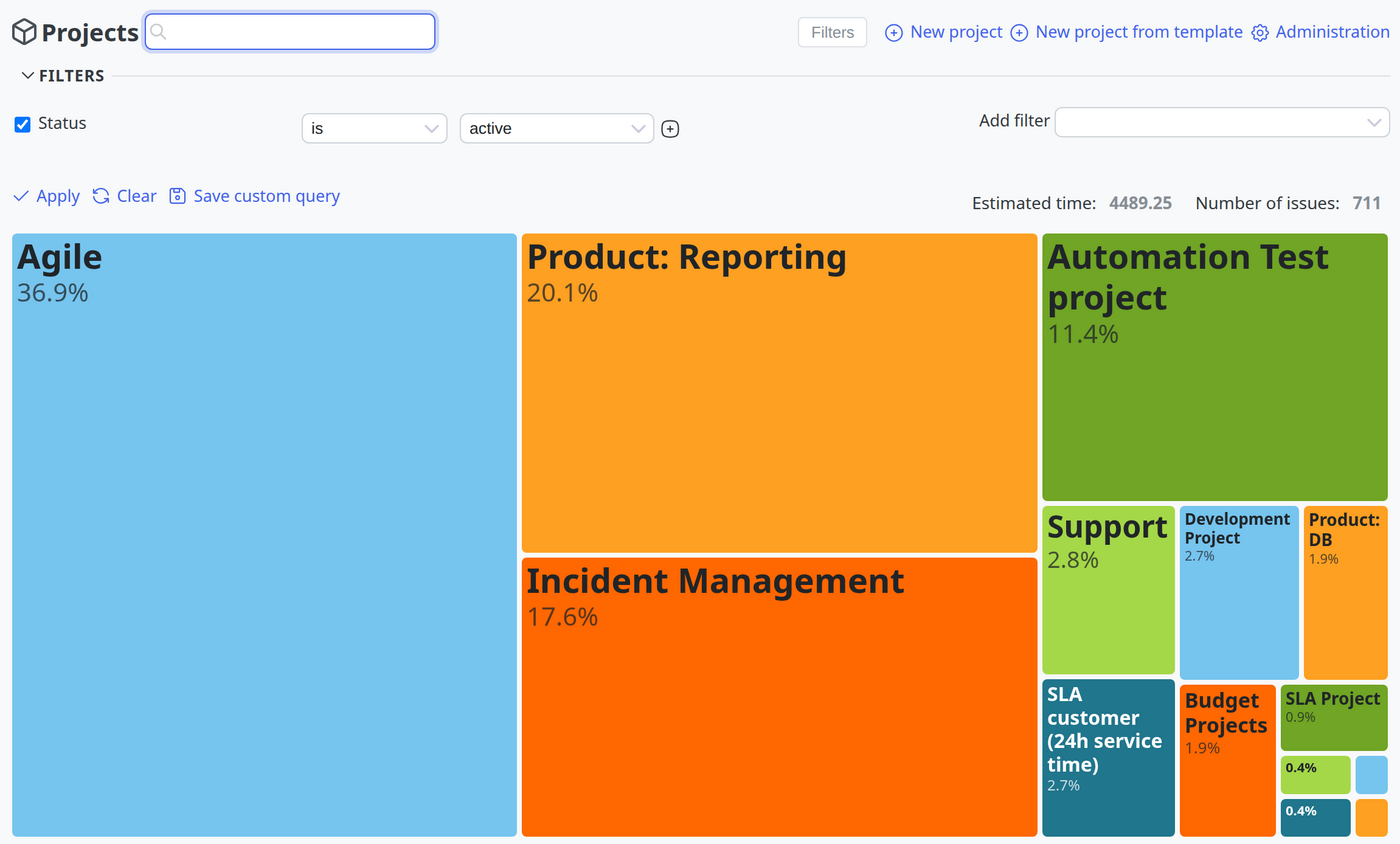
Treemap
Projects as areas: the larger the area, the more open issues, hours or budget overrun. You pick the value from a list.
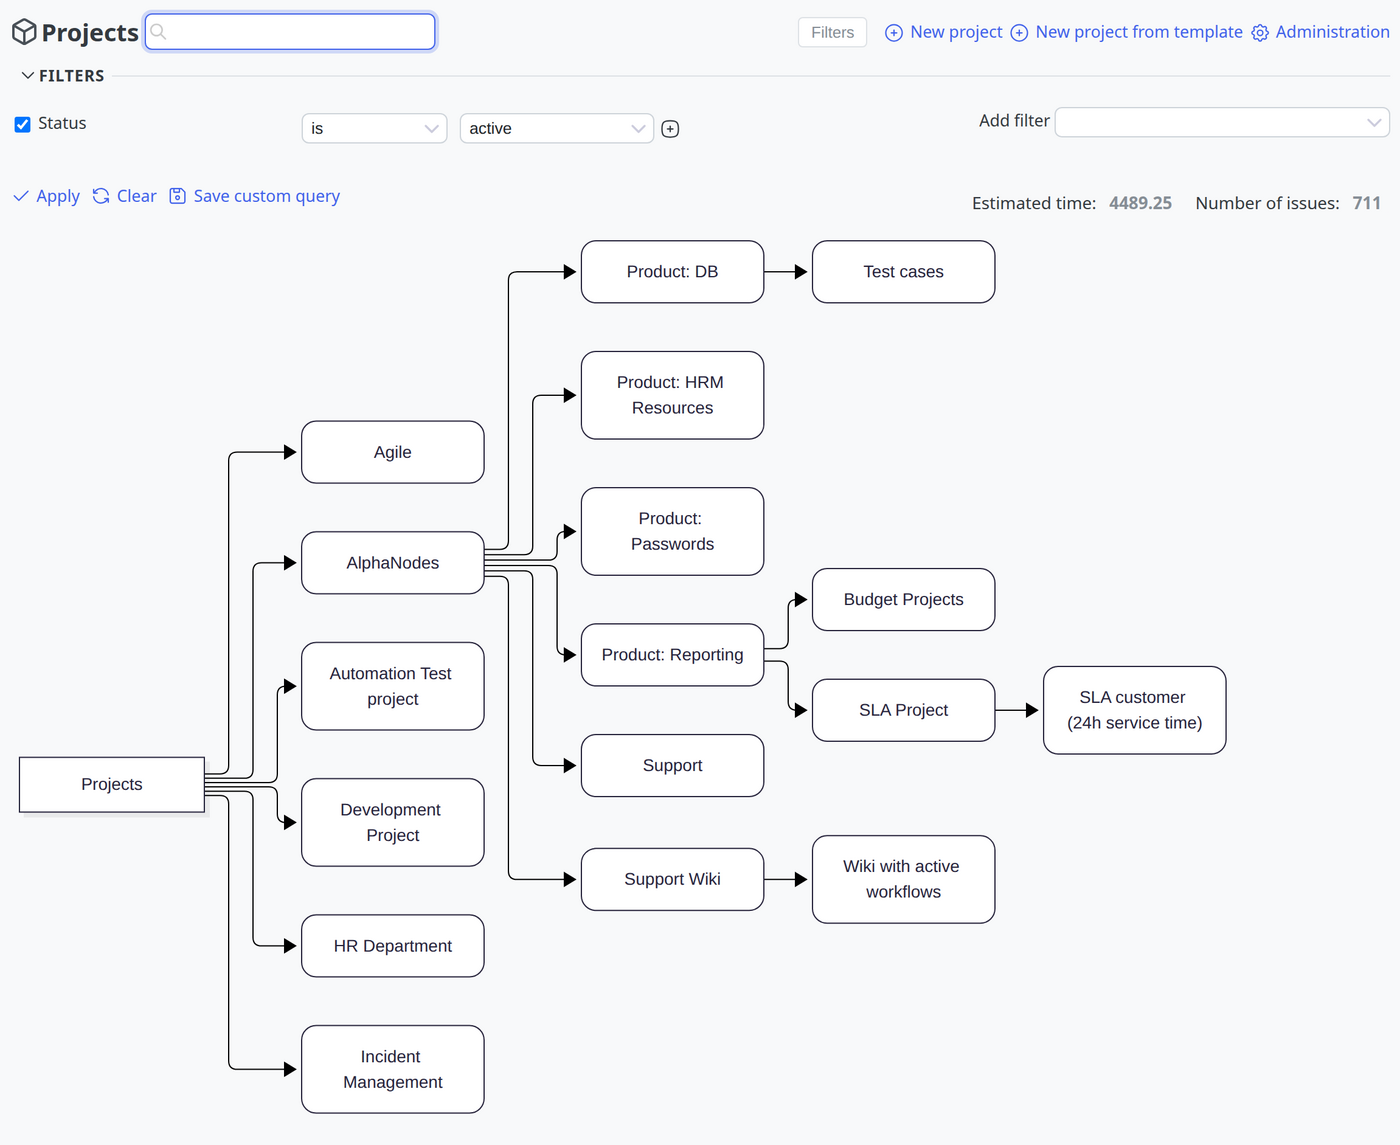
Flowchart
The hierarchy of projects and subprojects as a diagram. Each box links to the project.
There is also a Sankey diagram of the project hierarchy, and for administrators an admin list with functions such as close, archive and copy. Read more about all views in our Chart Guide.
Get to the right project faster
- Live search: the list filters while you type. With
name:,desc:orid:you search a specific field. - Project icon and color: an icon and a color of your own make projects easy to tell apart in the list, the calendar and on the board.
- Default page per project: when you open a project, you can land directly on the issue list or the wiki instead of the overview.
From version 4.7.0 there is the dashboard block “Chart: Projects”. It shows projects as a chart, for example by status, project lead or customer. Read more under Reports and Dashboards.
Useful for:
- Project managers and project portfolio managers
- IT managers and lifecycle managers
- Management and controlling
- Administrators and everyone who works with many projects every day
