
Looking after a single project in Redmine is manageable. With five projects the clicking starts: issue list in the first project, back, next project, and so on. In the end you have seen five lists and still do not know where things are stuck.
The Taskboard of the Reporting Plugin also works across projects. All issues from all projects you have access to then sit on one board.
The board works outside a single project as well
Most people know the board view from within a single project. It is available in the cross-project issue list just as well, the view you open via the main menu that shows all issues you have access to.
Within a project the board shows you the state of that one project. Across projects it shows the state of your entire area.
Grouping by project
The view gets interesting with the grouping. If you select project, every project gets its own continuous row across all status columns. Those rows are called swimlanes.
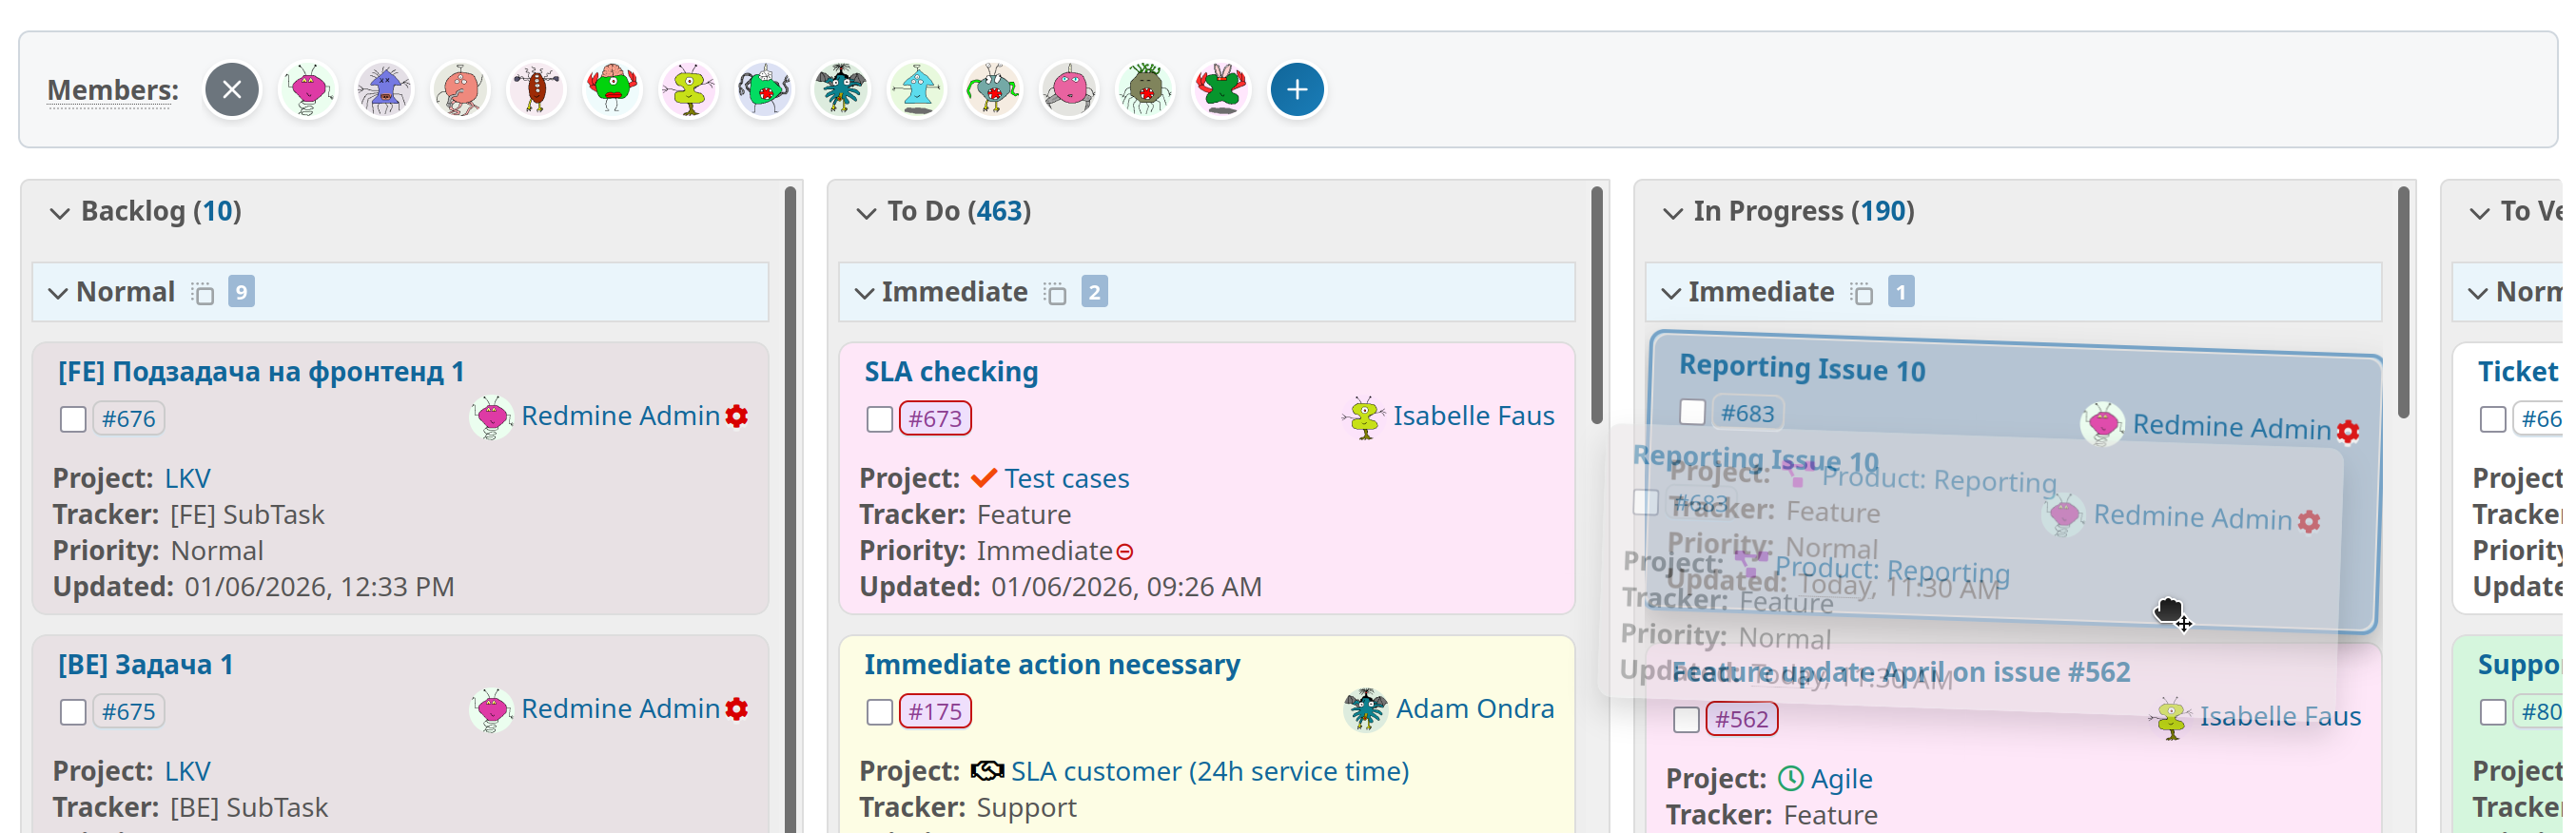
At a glance you see:
- in which project most issues are stuck in “Review”
- which project has nothing in progress although it should be running
- where work is piling up that was still moving three weeks ago
An issue list does not show you that, no matter how well you filter.
The board uses the same drag and drop logic as in the project view. If you drag a card into another project row, the issue changes its project. Practical for issues that ended up in the wrong project, because you do not have to open them one by one.
Grouping by person
The second grouping that makes sense across projects is assignee.
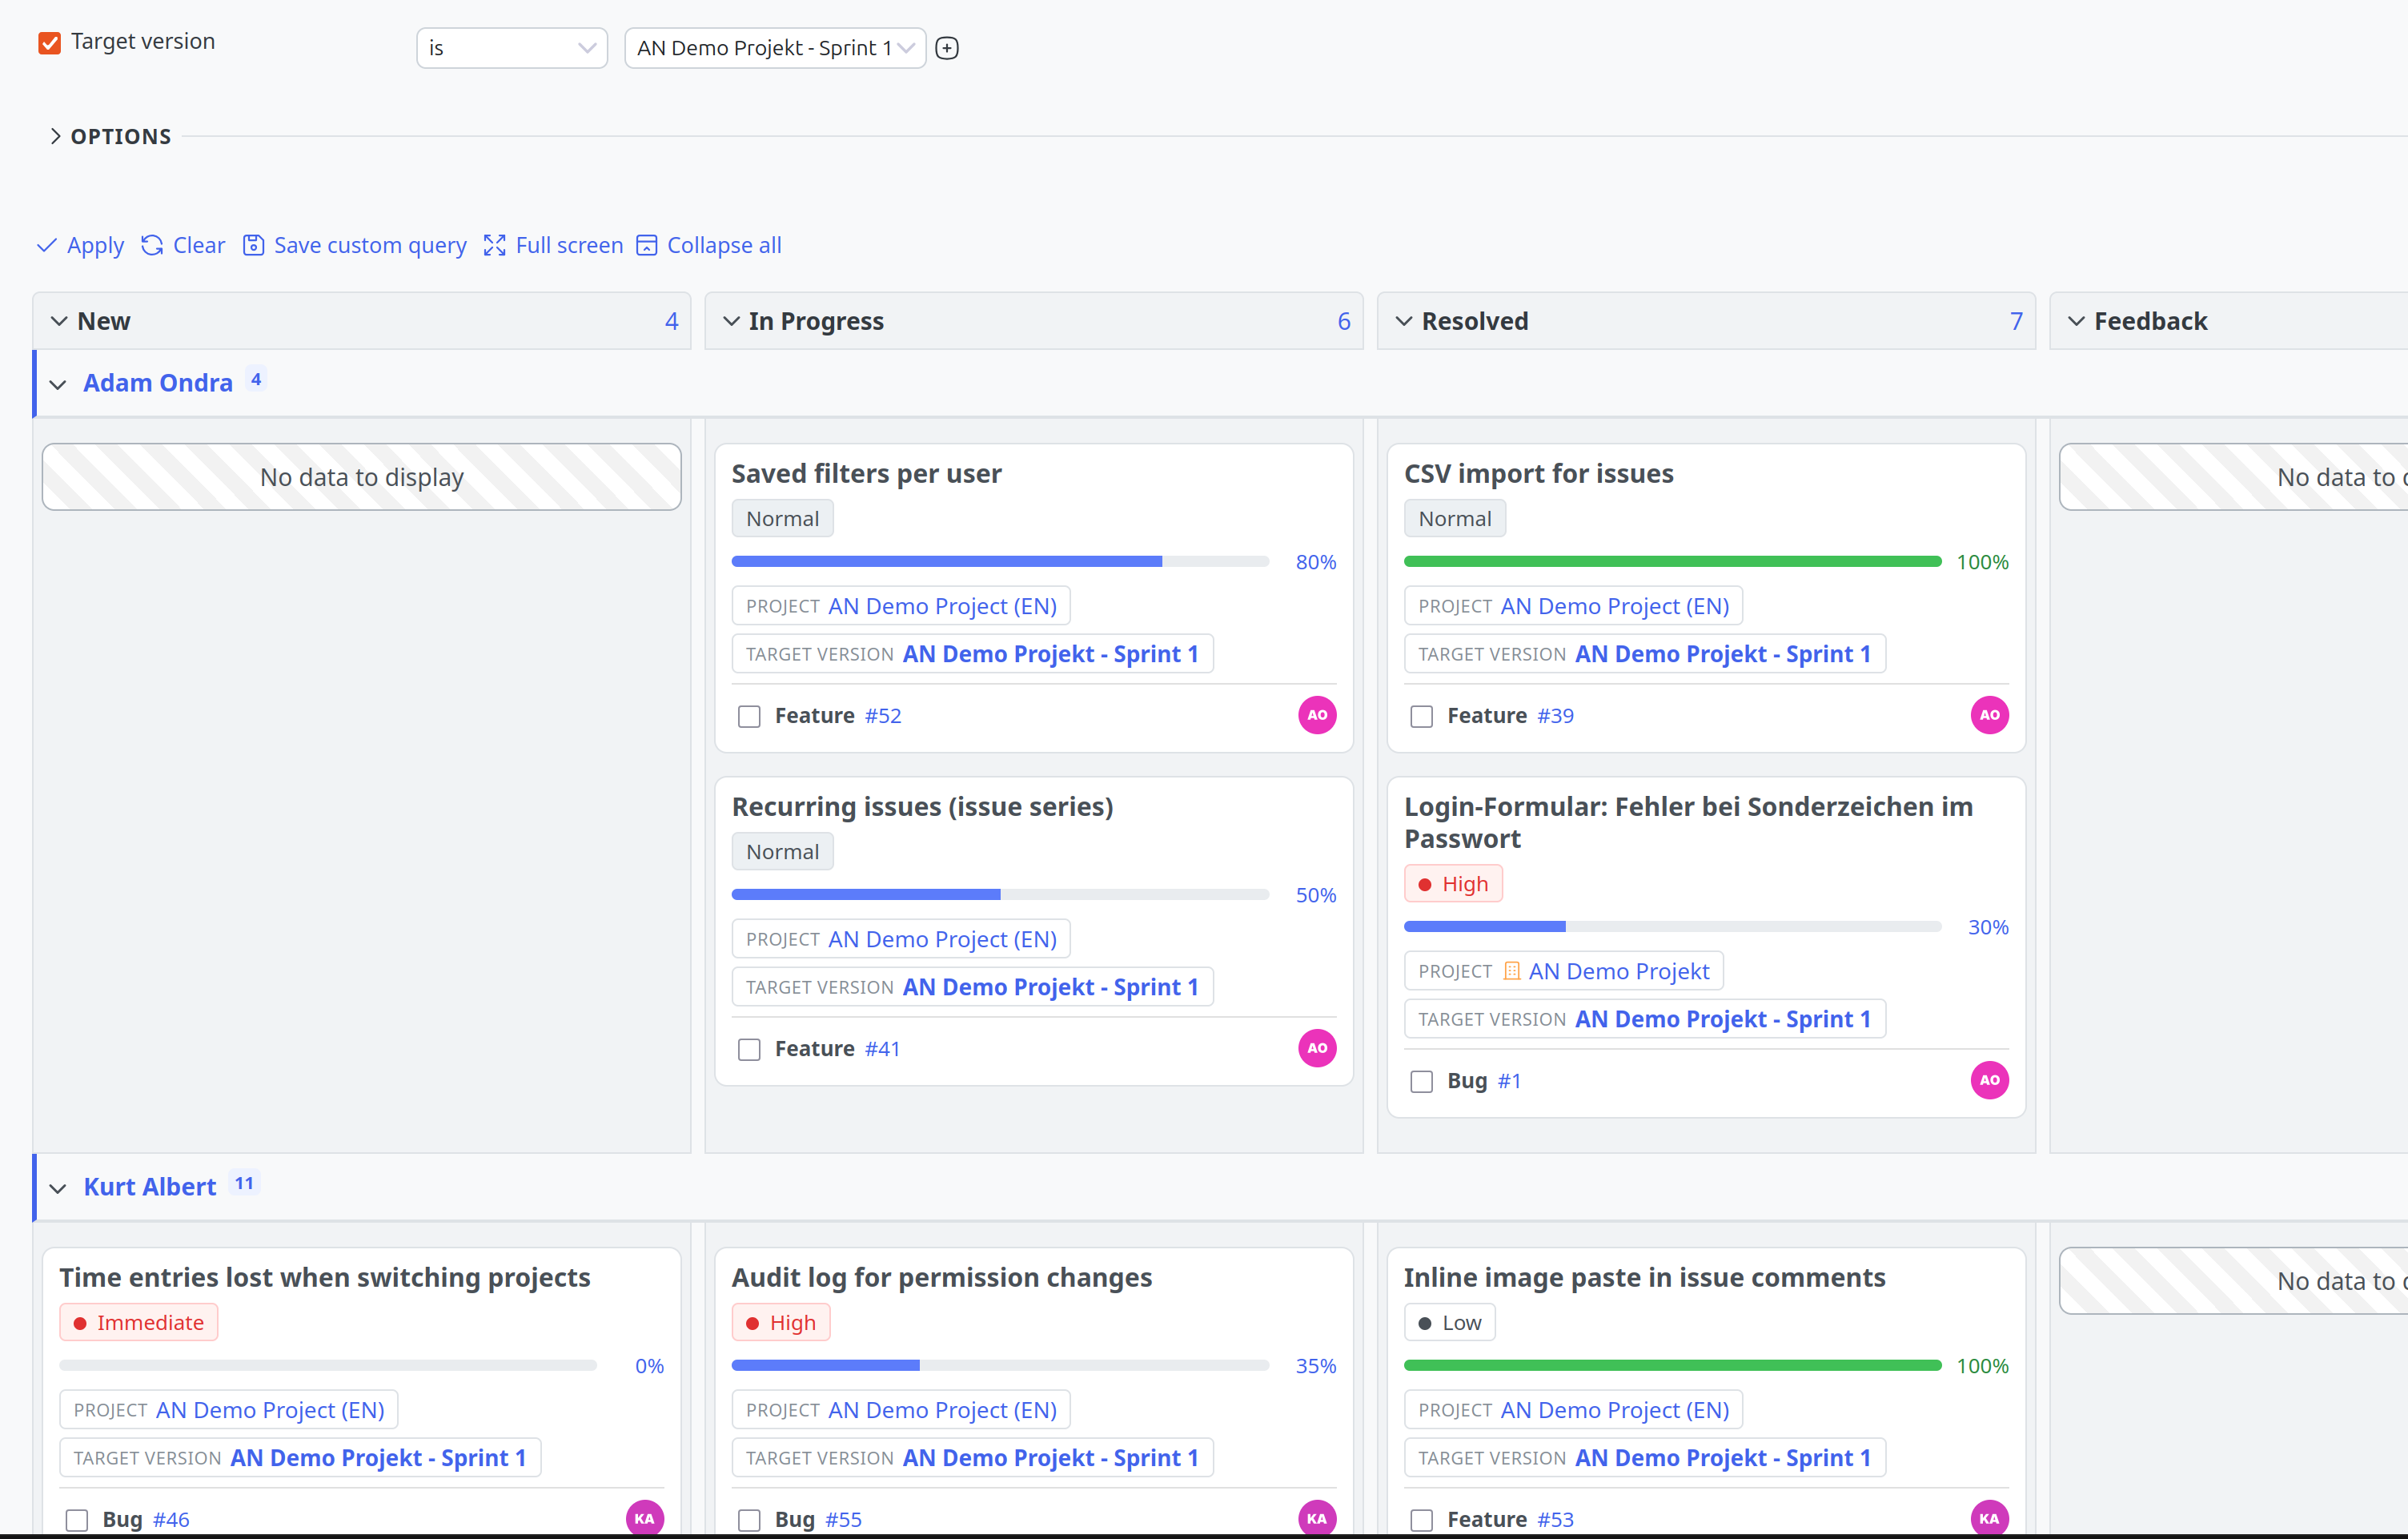
Within a project this shows you who is working on what. Across all projects you see the actual total workload of a person.
That is often missing in project work. Every project manager sees their own project and counts three open issues for a colleague. In reality there are three in your project, four in the next one and five in the one after that. Only the view across all projects shows that they are not working slowly, they are overbooked.
Large numbers of issues do not slow the board down
Many teams do not even try cross-project boards, because they expect an unusable view with a few thousand issues. With some board solutions that worry is justified. They either load everything at once, or they draw a hard line, often at 500 entries, and show nothing beyond that.
The Taskboard initially loads only a defined number of issues per column and fetches the rest while you scroll. On a grouped board the same applies to the swimlanes, so further groups are added automatically. There is no hard limit and no “load more” button either. You simply keep scrolling.
That is why the view across all projects also builds up without noticeable waiting time with large numbers of issues. Exactly where a board delivers the most value, with many projects and many people involved, it stays usable.
The board scrolls as a single unit. The member bar and the status headers stay visible at the top, so even after 200 cards you still know which column you are in.
How to set up the view
Save the view as a query, then it is one click away for you and your team:
- Open the cross-project issue list via the main menu
- Set your filters, typically “status = open”, possibly narrowed down to the projects of your area
- Switch to Board under Options at Display results as
- At Group results by select either project or assignee
- Save the query, give it a meaningful name and share it with your team
Two saved views side by side have proven themselves: one grouped by project for the weekly look across all projects, one grouped by person for the question of who currently has too much on their plate.
One limitation you should be aware of: Grouping by category does exist across projects, but drag & drop then only changes the status and not the category. That comes from Redmine itself, where categories are defined per project. Moving them across projects would not be unambiguous.
Who benefits from this
Not everyone. If you look after a single project, you are better off with the project view, because it contains less noise.
In three situations the cross-project view pays off:
- Team leads with several projects: the weekly look at where things are stuck
- Support and internal service teams: issues come from many projects, but the team is the same
- Resource planning: who has how much open across all projects
In all three cases one board replaces a series of individual queries. And unlike a report that somebody has to compile, it is always up to date.
All information about our extensions for Redmine can be found on the product page. The Reporting Plugin is subject to a fee and is available separately or as part of our Business-Class Bundle as well as the Enterprise+ Bundle. The function described here can be tested extensively in our online demo.