
Dashboards are not a substitute for reports, but they do allow you to customize certain areas of Redmine to help you identify problems more quickly. By displaying the amount of daily data volume in the most relevant places in Redmine: Redmine Home page, Redmine project overview page.
The new dashboard functionality of the Additionals Plugin allows you faster and more convenient way to access the data relevant to you and your team in Redmine.
Dashboard introduction
Dashboards have become an important part of project management. Because they can be configured to provide completely different views of the same data. Depending on the user.
While a developer’s focus is more on performing the daily tasks assigned to him. The project manager concentrates on assigning outstanding tasks and meeting deadlines. And the stakeholder is more likely to focus on the budget.
Since everyone works with the same software and the basis is the same, dashboards help to present the different information in a way that is suitable for the different groups.
Learn more on this topic in other blog posts:
Available Dashboard blocks for Redmine
If you are working with the Redmine standard version and want to use the Dashboard, the following blocks are currently available for you with the Additionals Plugin:
Standard Redmine Dashboard blocks
- Query: Issues
- Text
- Text (asynchronous)
- Latest news
- Documents
- Static spent time
- Atom+RSS Feed
- Standard content left / Standard content right
- Activity
- Welcome
- Project information
- Subprojects
- Issue tracking
- Time tracking
- Members
Users with appropriate permission can easily assign dashboard blocks to a dashboard area like the Redmine Home page or the project overview page.
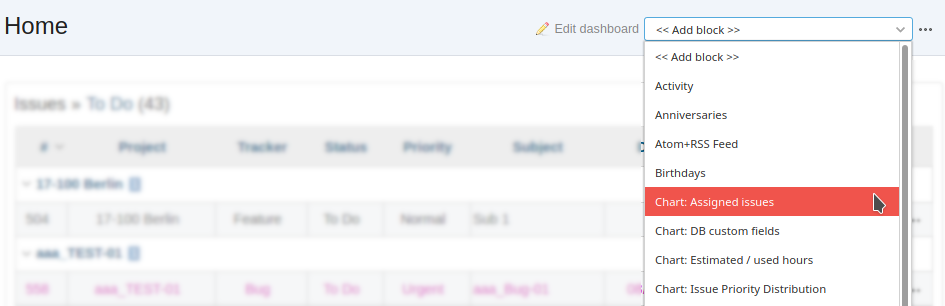 The content of your dashboard can be easily designed using the available blocks.
Some of the dashboard blocks are configurable after you have assigned them. Some can be added several times per dashboard. Some of them are general available and others only depending on the area you are.
Redmine plugins with dashboard support
If you are using plugins, that support the Dashboard function as well, you will have a lot of more blocks available for adding. These might be one of the following plugins, which are currently supporting the dashboard functionality:
DB Dashboard blocks
General available Dashboard blocks are:
- Chart: DB custom fields (Maximum usage: 1)
- Query: DB entries (Maximum usage: 8)
- DB entries summary (Maximum usage: 1)
Passwords Dashboard blocks
General available dashboard blocks are:
- Query: Passwords entries (Maximum usage: 8)
- Passwords entries summary (Maximum usage: 1)
HRM Dashboards blocks
The HRM Plugins comes with a huge number of blocks for your dashboard. Depending on the area you want to add them, they may differ. The following blocks are only available on the HRM overview page:
- Query: Working hours calendar (Maximum usage: 8)
- Query: Groups (Maximum usage: 8)
- Query: Users (Maximum usage: 8)
- Query: Project members (Maximum usage: 8)
- Query: Holidays (Maximum usage: 8)
- Query: Attendance (Maximum usage: 8)
- Anniversaries (Maximum usage: 1)
- Holidays (Maximum usage: 1)
- Birthdays (Maximum usage: 1)
- Required actions (Maximum usage: 1)
- Chart: Distribution of project effort (originally provided by Reporting, specifically for this site)
HRM blocks that can be used in the dashboard on the main page of Redmine:
- Anniversaries (Maximum usage: 1)
- Holidays (Maximum usage: 1)
- Birthdays (Maximum usage: 1)
- My attendance (Maximum usage: 1)
- My planned hours (today) (Maximum usage: 1)
- My required actions (Maximum usage: 1)
- Query: Working hours calendar (Maximum usage: 8)
- Query: Groups (Maximum usage: 8)
- Query: Users (Maximum usage: 8)
- Query: Project members (Maximum usage: 8)
- Query: Holidays (Maximum usage: 8)
- Query: Attendance (Maximum usage: 8)
Reporting Dashboards blocks
The Reporting Plugins also provides various blocks for your dashboard. Depending on the area you want to add them, they may differ, as well. General available dashboard blocks of the Reporting Plugin are:
- Query groups (Maximum usage: 1)
- Query: Spent time (Maximum usage: 8)
- Query: Files (Maximum usage: 8)
- Query: Versions (Maximum usage: 8)
- Chart: Issue custom fields (Maximum usage: 1)
- Chart: Assigned issues (Maximum usage: 1)
- Chart: Issue tracker division (Maximum usage: 1)
- Chart: Issue Priority Distribution (Maximum usage: 1)
- Chart: Estimated / used hours (Maximum usage: 1)
- Chart: Wiki activities (Maximum usage: 1)
Available dashboard blocks for the welcome page dashboards are:
- Query: Log (Maximum usage: 8)
- Query: Projects (Maximum usage: 8)
- Latest user logins (Maximum usage: 1)
- My watch list (Maximum usage: 1)
- Chart: Spent time distribution of all projects (Maximum usage: 1)
Available dashboard blocks for the project overview dashboards are:
- Project planning (Maximum usage: 1)
- Issues with project relation (Maximum usage: 1)
- Tags (Maximum usage: 1)
- Chart: Issue status division (Maximum usage: 1)
- Chart: Issue category division (Maximum usage: 1)
- Chart: Overdue issues (Maximum usage: 1)
Customers, working with the HRM & Reporting Plugin Bundle may also use additional dashboard blocks for the HRM overview area, provided by the Reporting Plugin:
- Latest user logins (Maximum usage: 1)
- Chart: Spent time distribution of all projects (Maximum usage: 1)
The thing about Query dashboard blocks
In Redmine it’s typical to filter list (e.g. issue list, project list, spent time entries) according to your need. Those filtered list results can be implemented into your dashoards via Query block selections. So you can restrict the data, shown on a dashboard to more specific values.
The primary goal of dashboards is to provide the viewer with an immediate overview of the respective facts of the individual projects. Or to display the metrics that are currently important to you.
Since the individual blocks are usually linked to the respective content, the dashboard is the ideal diving board into the project. For example, for further analyses or more detailed information on the current state of affairs.
Basic dashboard functions
Basically when installing the Additionals Plugin for Redmine the dashboard functionality is only available to users with administration permission. Others will not see anything new or can modify the dashboard pages (which are currently the Redmine Home page or project overview pages). Dashboard permissions are:
- Save dashboards
- Set system dashboards
- Share dashboards
After installation the Additionals plugin all dashboard areas look as usual as always.
If you want to use the dashboard function you have to set the dashboard permissions for each user role on your system. After that, your users may use the dashboard functionality accordingly. Of course, people will always see only the dashboard content according to their user permission, defined in the Redmine configuration.
 Set dashboard permissions, if you want to use the functionality in Redmine
If you don’t want to use the dashboard functions leave them as they are and don’t set the permissions. Usually the system default “Project dashboard” looks like the standard project page of Redmine. It contains the same areas as “blocks”. These can be repositioned or partially hidden. It is up to the user with administration permission if you want to change it. If not, just leave it the way they are.
Test Dashboard Function for Redmine
Want to learn more about the Dashboard for Redmine? Check out the possibilities in our online demo: Our public demo instance is great for getting a first impression of the functionality, what blocks are available when using the plugins of the AlphaNodes Enterprise+ Bundle and how easy it is usable.